Allison Horst
@allison_horst
Data Scientist Advocate @ObservableHQ & teaching environmental data science @ucsantabarbara. Opinions mine. Data | Education | Art | Community. She / her.
ID:973955318987210752
https://allisonhorst.com/ 14-03-2018 16:13:38
4,3K Tweets
24,9K Followers
3,2K Following


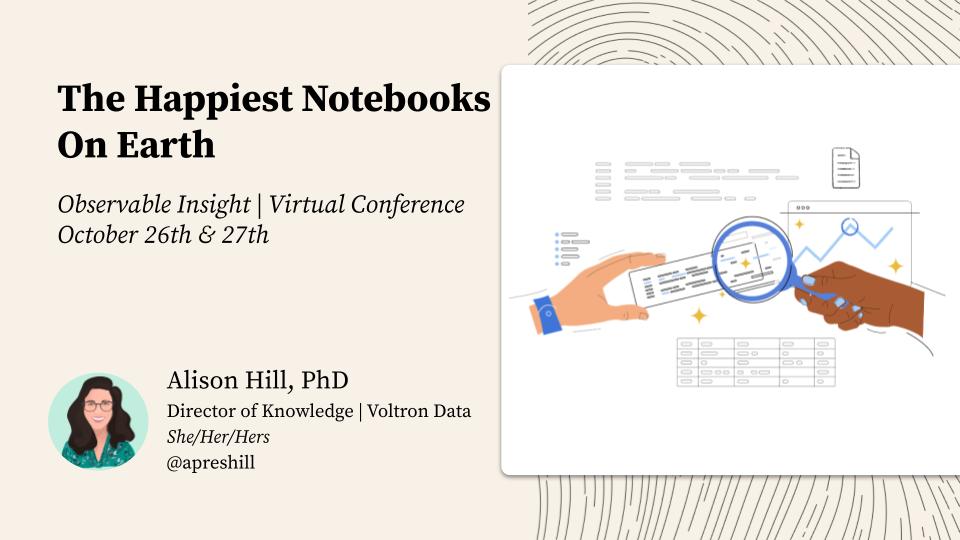
EVERYONE who is even remotely interested in or curious about Observable NEEDS to see this presentation by Alison Haunted Hill 🏚

Jazzed about the upcoming #ObservableInsight conference – starting tomorrow!
✍️ Register for free: hopin.com/canvas/events/…
Join me this Thursday October 27, when I'll be speaking about the happiest notebooks on Earth 🏰🐭👸🌹
(I may be biased, but I'm also jaded 😉)


Excited for the Observable workshop on Oct 28! Mike Freeman & Allison HORRORst 👻🎃 are teaching 'Introduction to Observable - Companion Visualization Tool for Your Analysis'...
eventbrite.com/e/introduction…
#openscience #opensource #tidyverse #dataviz #datascience #rinpharma #JavaScript

Great shout out 📢 from one of our favorite sites Nathan Yau - check out these data science illustrations from recently joined Observable team member Allison HORRORst 👻🎃 flowingdata.com/2022/10/24/edu…


Now I have a #QuartoPub custom grid listing that looks like something.
It improves styling of the buttons and also removes height for images allowing a proper scaling of them.
Text can be changed thus includes icons, e.g., from shortcodes (in theory).
github.com/mcanouil/quart…


So happy to share my first first-author conference paper! I (and four brilliant collaborators: Vidya Setlur Bridget Cogley, #FindTheFiat Functional Aesthetics Arvind Satyanarayan and Marti Hearst) found that readers prefer charts with more text and that this text has subtle and strong influences on reader takeaways. 🧵/12


📣 Next week, I'll be speaking at Observable Insight 2022 Observable
🎉 It’s online and FREE 🎉
So many great talks in the lineup - Alison Haunted Hill 🏚 Maya Gans Olivia Vane Max Graze Ian Johnson 💻🔥 Shirley Wu 吴雪扬 | BLM Irene de la Torre Mike Bostock melody meckfessel + MUCH MORE
#dataviz #datascience

