Cara Thompson
@cararthompson
👋 #Dataviz Consultant with an academic background
💙 Maximising the impact of other people's expertise
ID: 331590772
https://linktr.ee/cararthompson 08-07-2011 12:13:56
1,1K Tweet
2,2K Followers
300 Following


I just watch this talk by Cara Thompson again today and I love it! ➡️Building a Dataviz Design System in ggplot2 I'll definitely talk about this in my upcoming productive-r-workflow.com 😀 cararthompson.com/talks/rmedicin…


Reading & Resources ⭐️ TOP 5 ⭐️ Here's what's been popular in our community in the last week! 1) Level Up Your Plots: Using colour, annotations, text hierarchy & other tricks to make your data story stand out Great post by Cara Thompson! cararthompson.com/talks/nhsr2023…


🚀 Join our second #DataVisualization Event this month with Cara Thompson! Elevate your data storytelling skills through effective text management, and color usage. When: Nov 30, 2023 at 6:00 PM CET RSVP: meetup.com/rladies-rome/e… #RLadies @fgazzelloni #rstats #ggplots

Finally, Cara Thompson presentation for the R-Ladies Cambridge '#dataviz lunch' is available on YouTube. Here is the link: youtube.com/watch?v=TGU-ek… More videos of the 2023 "dataviz lunch" edition will be coming soon. #rstats

🥁 Hurry up! Just a little be more than a hour for the next R-Ladies Rome event: Ten tips for better text: typography meets ggplot and friends. 🗣 Speaker: Cara Thompson 📆 When: November 30, 2023 at 6:00 PM CET on Zoom 🔗 RSVP: meetup.com/rladies-rome/e…

📢 Missed our engaging Data Visualization event with Cara Thompson or you'd like to watch it again? 🎥 The recording is now available on our YouTube channel ✨ Watch now: youtube.com/watch?v=ZC6Gdg… 📚 Material: cararthompson.com/talks/rladiesr… #DataViz #RLadies #RStats Federica Gazzelloni® (she/her)

And for our final talk from #ShinyInProduction 2023, we have Cara Thompson (Cara Thompson) with her British Bake Off themed talk on how to make text shine in your #datavisualisations without stealing the show ✨ youtube.com/watch?v=GWngjn… #RStats #GBBO


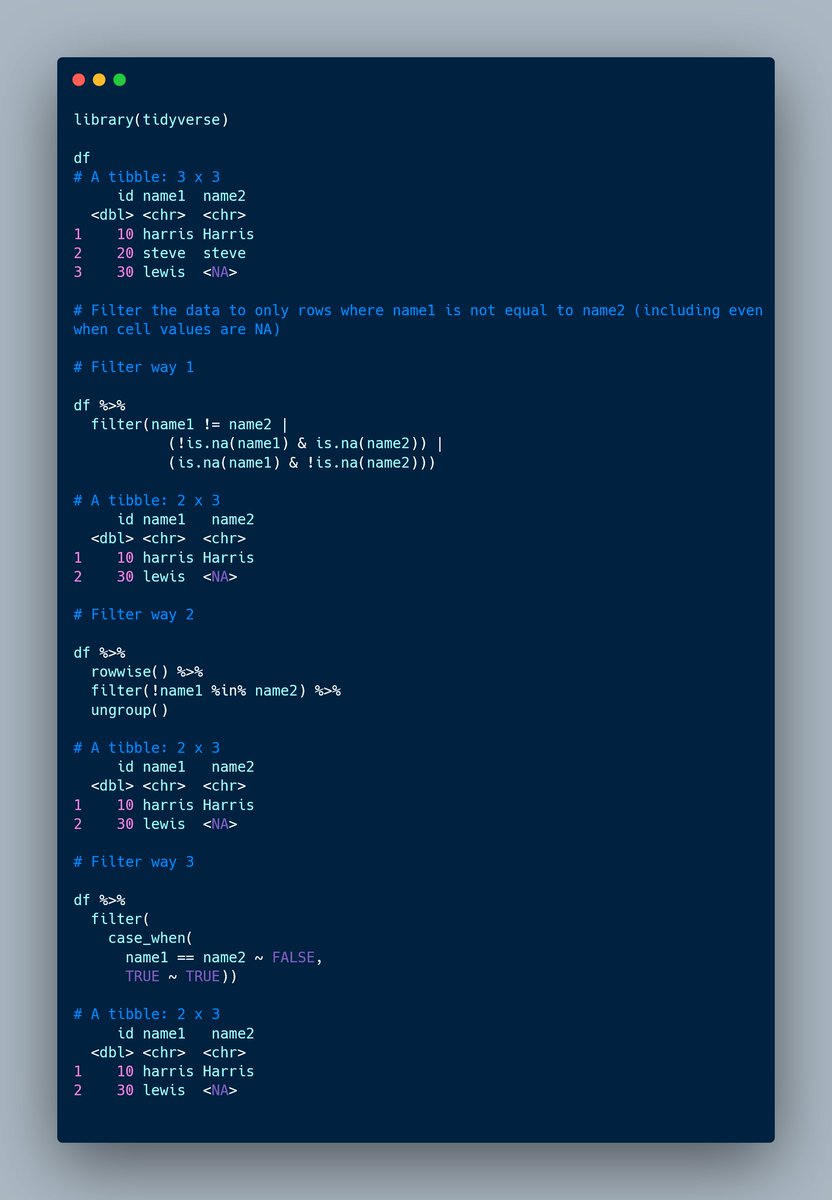
Inspired by a post shared by Cara Thompson, this example is a good reminder that there are always multiple solutions for any one #rstats problem.🌟 If you are curious about how dplyr::filter() evaluates NAs, you can read more here: github.com/Cghlewis/data-…


Thanks Neil Thurman ! It was a pleasure working on this for you. Congratulations on the publication!

We're excited about our next RGlasgow meetup! Cara Thompson Cara Thompson is joining us to share expertise in data visualisation, chatting through 'Advanced Visualisation in R: From alright, to all ready to publish' 18:30 23rd May, ARC, Byers Road meetup.com/rglasgow/event…


Elevate your data viz game with Cara Thompson! Her workshops are a goldmine of tips & tricks for creating stunning, impactful visuals. Don't miss out on learning from one of the best in the field! #DataViz 👉 Sign up: bit.ly/BIPdatavizwcara #AcademicTwitter


🚀 Ready, Steady, Viz! Join us for tips, tricks, and no-code solutions to create standout #dataviz. Learn from a decade of experience by Cara Thompson & make your visuals clear, compelling, and memorable. June 11th @ 1PM ET 👉 Sign up: bit.ly/BIPdatavizwcara #AcademicTwitter


This remains my favourite example of a good timeline plot. Used it as an example in a training session last week, with credit. Two parallel stories (the cases count, the event dates), hierarchy in points and annotations... Thanks again for creating and sharing it Dr Christian Hoggard !

Parameterized plot functions from Cara Thompson just rocked R/Medicine 2024 R Medicine. Super useful! cararthompson.com/talks/ah-ha-ha…
