Tom Bliss (@datawithbliss) 's Twitter Profile
Tom Bliss

@datawithbliss

Sr. Manager, Football Ops Data Scientist at @NFL. Alum of @Columbia (Data Science) and @UWMadison (Physics/Astronomy). Born / raised in Oakland, CA 🇬🇾🇺🇸.

ID: 1041500469640736769

linkhttp://datawithbliss.com calendar_today17-09-2018 01:33:56

1,1K Tweet

6,6K Followers

630 Following

Ryan M. Rodenberg (@sportslawprof) 's Twitter Profile Photo

“A Comprehensive Survey of the Home Advantage in American Football,” new academic paper forthcoming in the Journal of Quantitative Analysis of Sports by Luke Benz, Bliss & Michael Lopez -- degruyter.com/document/doi/1…

Tom Bliss (@datawithbliss) 's Twitter Profile Photo

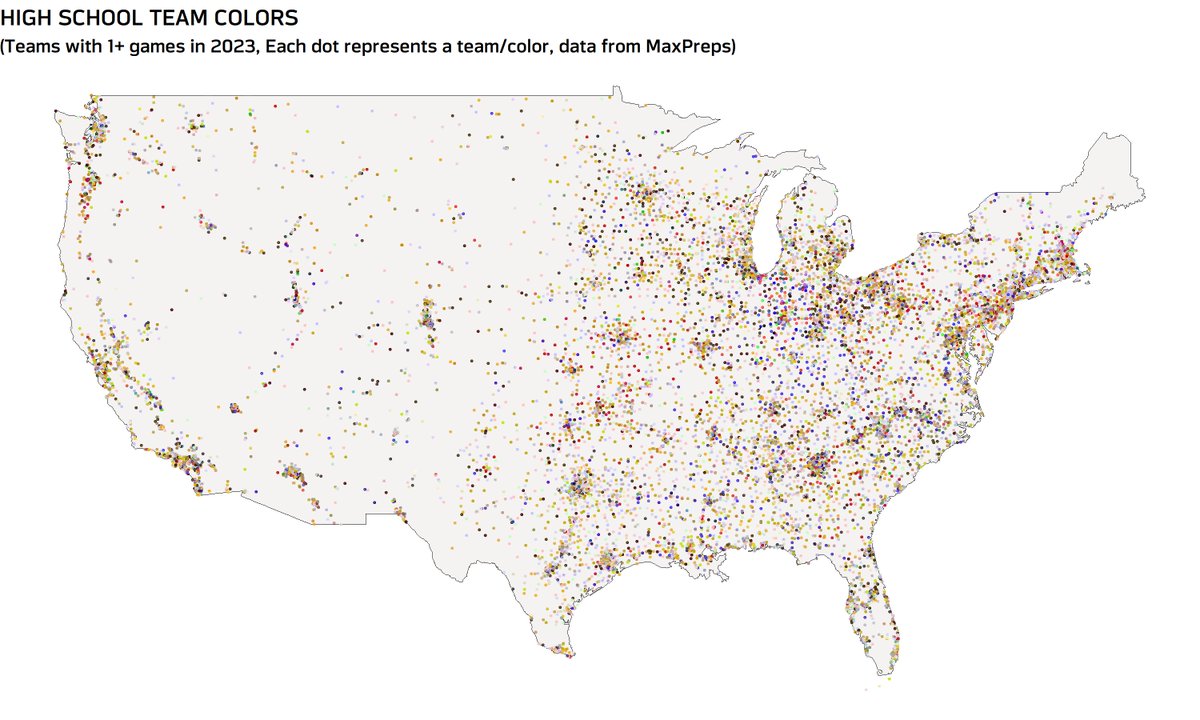
Most common high school colors of teams that played 1+ 🏈 game in 2023 (using data from MaxPreps): 1. White 2. Black 3. Gold 4. Red 5. Blue

Most common high school colors of teams that played 1+ 🏈 game in 2023 (using data from MaxPreps):

1. White
2. Black
3. Gold
4. Red
5. Blue
Next Gen Stats (@nextgenstats) 's Twitter Profile Photo

Come join the Next Gen Stats team in LA! We are hiring a year-round, part-time researcher, with seasonal roles to follow. This position will work with broadcast partners and the NFL content team, using NGS data to tell compelling stories. Apply Now: grnh.se/dedb3d928us

Women in Sports Data | September 7, 2024 (@winsportsdata) 's Twitter Profile Photo

Tickets for #WinSportsData2024 on September 7 are now available! 🎉 3 inspirational panels. 8 transformational talks. 1 hackathon champion, with $10K up for grabs. The future of sports is now. We'll see you courtside. eventbrite.com/e/women-in-spo…

Nick Wan (@nickwan) 's Twitter Profile Photo

I'm launching a new Kaggle competition! We're using the new swing length and bat speed data from Baseball Savant to predict batted ball outcomes. Hoping we can continue pushing out more public work around hitting metrics kaggle.com/competitions/n…

Tom Bliss (@datawithbliss) 's Twitter Profile Photo

99.8% of NFL punts since '01 were from a traditional punting formation. The 0.2% were from a FG or scrimmage formation in an attempt to trick the opposition/maximize net yards. Fake FG punts have decreased since mid 2000s and the last fake scrimmage punt was in '18 (PIT@BAL).

99.8% of NFL punts since '01 were from a traditional punting formation. The 0.2% were from a FG or scrimmage formation in an attempt to trick the opposition/maximize net yards.

Fake FG punts have decreased since mid 2000s and the last fake scrimmage punt was in '18 (PIT@BAL).
Tom Bliss (@datawithbliss) 's Twitter Profile Photo

For QB competitions since '16, 18/28 (64%) of the winners (defined as starting reg wk 1) had the highest preseason EPA/play (via NGS). Also, on average, the winners had an preseason EPA/play that was +0.2 higher than the losers. Here is a breakdown of the last 3 seasons & '24.

For QB competitions since '16,  18/28 (64%) of the winners (defined as starting reg wk 1) had the highest preseason EPA/play (via NGS). Also, on average, the winners had an preseason EPA/play that was +0.2 higher than the losers.

Here is a breakdown of the last 3 seasons & '24.
Ron Yurko (@stat_ron) 's Twitter Profile Photo

#CMSAC registration is live! stat.cmu.edu/cmsac/conferen… Check out our speakers including keynote address by Dr Katherine Evans (Katherine Evans), invited talk by #NFL Tom Bliss Tom Bliss, + this year's #baseballanalytics workshop led by Jim Albert (Jim Albert) & David Dalpiaz!

Michael Lopez (@statsbylopez) 's Twitter Profile Photo

Kickoff stats through Preseason W2 Return rate: '22: 59% '23: 64% '24: 78% Avg Field Position (all KOs, returns only): '22: 24.8, 24.6 '23: 23.9, 23.0 '24: 28.3, 27.5 Big Play Returns (40+ yd): '22: 11 '23: 6 '24: 15 OOB/Short KO rate: '24: 3%

Ron Yurko (@stat_ron) 's Twitter Profile Photo

You'll get to see Tom Bliss present this paper at #CMSAC on Nov 2nd! Register now! stat.cmu.edu/cmsac/conferen… #NFL #sportsanalytics

Tom Bliss (@datawithbliss) 's Twitter Profile Photo

Using play by play data from the last two Pro Bowls, one can recreate traditional football analytics metrics such as expected points and expected completion percentage for flag football. Below are plots of the model results. More details on my blog: datawithbliss.com/#/analyzing-nf…

Using play by play data from the last two Pro Bowls, one can recreate traditional football analytics metrics such as expected points and expected completion percentage for flag football.

Below are plots of the model results.

More details on my blog:
datawithbliss.com/#/analyzing-nf…
Andrew Patton (@anpatt7) 's Twitter Profile Photo

🚨🚨NFL Job 🚨🚨 Come work with myself and our engineering team to modernize our analytic environment across the Data & Analytics organization. In person only. job-boards.greenhouse.io/nflcareers/job…

Andrew Patton (@anpatt7) 's Twitter Profile Photo

The Big Data Bowl mentorship program application is live! Learn from team and league football analytics experts how to make a strong BDB submission and grow your skillset. operations.nfl.com/gameday/analyt…

Tom Bliss (@datawithbliss) 's Twitter Profile Photo

Dynamic kickoffs in the '24 preseason featured a 70.5% return rate (+15.7% from last yr) and an avg drive start from the 28.8 (+4.4 from last yr). Kickoff teams had the most success when the ball landed from the 1-5 yard line. More in the Extra Point: operations.nfl.com/gameday/analyt…

Dynamic kickoffs in the '24 preseason featured a 70.5% return rate (+15.7% from last yr) and an avg drive start from the 28.8 (+4.4 from last yr).

Kickoff teams had the most success when the ball landed from the 1-5 yard line.

More in the Extra Point:
operations.nfl.com/gameday/analyt…
Tom Bliss (@datawithbliss) 's Twitter Profile Photo

Here is the distribution of receiving team field position (after returns) by kickoff land spot this preseason. Generally, the deeper the kickoff, the worse the field position.

Here is the distribution of receiving team field position (after returns) by kickoff land spot this preseason.

Generally, the deeper the kickoff, the worse the field position.