James Gibson (@jamesgib7) 's Twitter Profile
James Gibson

@jamesgib7

(he/him)
MS candidate @Columbia
Undergrad @Dartmouth @Vassar
Currently working at @CIESIN
Data Scientist and Environmental Engineer
Out and proud 🏳️‍🌈

ID: 1603070589400498176

linkhttps://www.twitch.tv/jibbybaby777 calendar_today14-12-2022 16:53:23

15 Tweet

46 Followers

118 Following

CIESIN (@ciesin) 's Twitter Profile Photo

CIESIN’s 4 data sets on SDG indicators—access to electricity, an all-season road, public transport+urban public space—are on SDGs Today; and our @esri_Nonprofit Story Maps on the Rural Access Index and Clean Energy are featured on the storytelling tab. bit.ly/3hCxrdx

James Gibson (@jamesgib7) 's Twitter Profile Photo

Just finished a great virtual IPoster Session at AGU 2022 where I presented my work on “Computing Sustainable Development Goal Indicators with Global Open Data.” Check out my IPoster using the link below! AGU (American Geophysical Union) #SDGs …22fallmeeting-agu.ipostersessions.com/Default.aspx?s…

Just finished a great virtual IPoster Session at AGU 2022 where I presented my work on “Computing Sustainable Development Goal Indicators with Global Open Data.” Check out my IPoster using the link below! <a href="/theAGU/">AGU (American Geophysical Union)</a> #SDGs 

…22fallmeeting-agu.ipostersessions.com/Default.aspx?s…
James Gibson (@jamesgib7) 's Twitter Profile Photo

Using Global Open Data to Estimate SDG Indicator 7.1.1 storymaps.arcgis.com/stories/14afcd… #StoryMaps via ArcGIS StoryMaps #SDGs #DataScience #GIS

James Gibson (@jamesgib7) 's Twitter Profile Photo

Computing the Rural Access Index Using Global Open Data storymaps.arcgis.com/stories/581caf… #StoryMaps via ArcGIS StoryMaps #SDGs #DataScience #GIS

James Gibson (@jamesgib7) 's Twitter Profile Photo

Estimating Access to Public Transport in Urban Centers storymaps.arcgis.com/stories/739a8a… #StoryMaps via ArcGIS StoryMaps #SDGs #DataScience #GIS

James Gibson (@jamesgib7) 's Twitter Profile Photo

Assessing Prevalence and Access to Public Space in Cities storymaps.arcgis.com/stories/be4888… #StoryMaps via ArcGIS StoryMaps #SDGs #DataScience #GIS

CIESIN (@ciesin) 's Twitter Profile Photo

4 new ArcGIS StoryMaps on SDGs Today estimate indicators of select #SDGs progress: access to electric/an all-season road/public transport/an urban public space. arcg.is/1eHuOW arcg.is/1K1Hbv0 arcg.is/1e10vS arcg.is/0izifC bit.ly/3FW56IS

James Gibson (@jamesgib7) 's Twitter Profile Photo

As December comes to an end, I ask myself are winters in NYC getting warmer? I downloaded over 150 years of NOAA data for Central Park and visualized it in #Python and this is what I found. #ClimateAction #DataScience

As December comes to an end, I ask myself are winters in NYC getting warmer? I downloaded over 150 years of <a href="/NOAA/">NOAA</a> data for <a href="/CentralParkNYC/">Central Park</a> and visualized it in #Python and this is what I found. #ClimateAction #DataScience
James Gibson (@jamesgib7) 's Twitter Profile Photo

I downloaded over 150 years of NOAA NOAA NCEI precipitation data for Central Park and visualized it in #Python and found that total annual precipitation is generally increasing over time. How will more precipitation impact #NYC? #ClimateAction #DataScience

I downloaded over 150 years of 
<a href="/NOAA/">NOAA</a> <a href="/NOAANCEI/">NOAA NCEI</a> precipitation data for <a href="/CentralParkNYC/">Central Park</a> and visualized it in #Python and found that total annual precipitation is generally increasing over time. How will more precipitation impact  #NYC? #ClimateAction #DataScience
CIESIN (@ciesin) 's Twitter Profile Photo

#SDGs indicator+other CIESIN data development resources are now part of the Group on Earth Observations (GEO) Knowledge Hub. Software, trainings, map svcs, Esri Story Maps+more at: gkhub.earthobservations.org and gkhub.earthobservations.org/packages/e0ykm…. Data coming soon! SDGs Today Columbia Climate School

#SDGs indicator+other <a href="/ciesin/">CIESIN</a> data development resources are now part of the <a href="/GEOSEC2025/">Group on Earth Observations (GEO)</a> Knowledge Hub. Software, trainings, map svcs, <a href="/Esri/">Esri</a> Story Maps+more at: gkhub.earthobservations.org and gkhub.earthobservations.org/packages/e0ykm…. Data coming soon! <a href="/sdgstoday/">SDGs Today</a> <a href="/columbiaclimate/">Columbia Climate School</a>
CIESIN (@ciesin) 's Twitter Profile Photo

Representing #NASAsedac, senior digital archivist Robert Downs has been honored w/the 2023 Earth Science Information Partners (ESIP) Martha E. Maiden Award for lifetime achievement in leadership, dedication+collaborative spirit advancing the earth science information field. Congrats, Bob! Columbia Climate School

Representing #NASAsedac, senior digital archivist Robert Downs has been honored w/the 2023 <a href="/ESIPfed/">Earth Science Information Partners (ESIP)</a> Martha E. Maiden Award for lifetime achievement in leadership, dedication+collaborative spirit advancing the earth science information field. Congrats, Bob! <a href="/columbiaclimate/">Columbia Climate School</a>
James Gibson (@jamesgib7) 's Twitter Profile Photo

With the exception of one notable year in the 1940s, there has been a steady rise in annual average max temperature in #Philadelphia #Philly over the last 80 years. Data from NOAA, visualized in #Python. #DataScience #ClimateAction

With the exception of one notable year in the 1940s, there has been a steady rise in annual average max temperature in #Philadelphia #Philly over the last 80 years. Data from <a href="/NOAA/">NOAA</a>, visualized in #Python. 
#DataScience #ClimateAction
SDGs Today (@sdgstoday) 's Twitter Profile Photo

Today the Eco Ambassadors learned #AGOL basics & how James Gibson from @CIESIN uses GIS & data visualization for #SDG indicators🗺️ Our students have started developing ideas for their very own #StoryMaps that will showcase these new #geospatial data viz skills and creativity!
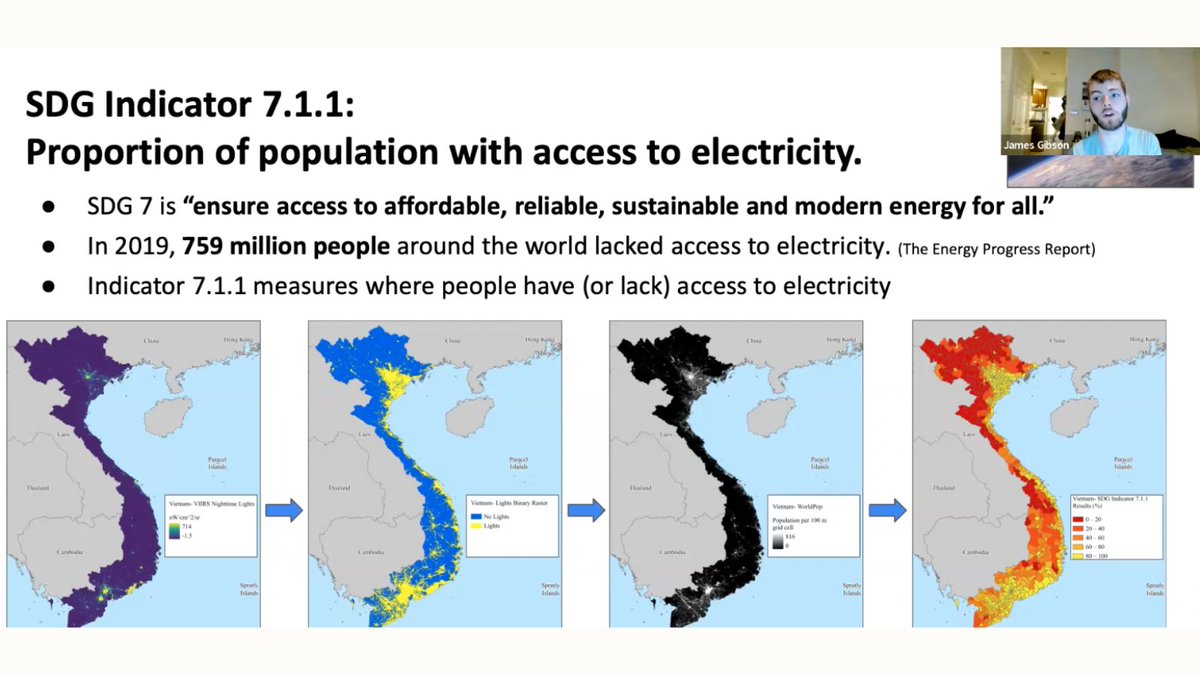
Today the Eco Ambassadors learned #AGOL basics &amp; how <a href="/JamesGib7/">James Gibson</a> from @CIESIN uses GIS &amp; data visualization for #SDG indicators🗺️

Our students have started developing ideas for their very own #StoryMaps that will showcase these new #geospatial data viz skills and creativity!
SDGs Today (@sdgstoday) 's Twitter Profile Photo

Thanks again to James Gibson for joining today's session of the Eco Ambassadors summer program! James shared the #geospatial analyses and data visualizations used at @CIESIN, and inspired our students to begin working with #GIS to work towards the UN's #SDGs 💻

Thanks again to <a href="/JamesGib7/">James Gibson</a> for joining today's session of the Eco Ambassadors summer program!

James shared the #geospatial analyses and data visualizations used at @CIESIN, and inspired our students to begin working with #GIS to work towards the UN's #SDGs 💻
James Gibson (@jamesgib7) 's Twitter Profile Photo

I started working on these four UN Sustainable Development Goal (SDG) indicator data sets when I first started working at CIESIN in 2020. It's so exciting to see them finally published through NASA SEDAC! 😍 #SDGs #UnitedNations #NASAScience sedac.ciesin.columbia.edu/data/collectio…

I started working on these four UN Sustainable Development Goal (SDG) indicator data sets when I first started working at <a href="/ciesin/">CIESIN</a> in 2020. It's so exciting to see them finally published through <a href="/NASA/">NASA</a> SEDAC! 😍 #SDGs #UnitedNations #NASAScience 

sedac.ciesin.columbia.edu/data/collectio…