Mark Gough (@techchartmark) 's Twitter Profile
Mark Gough

@techchartmark

πŸ“ˆ Technical Market Analyst & Investor | Specializing in Harmonic Trading πŸ“Š | #Bitcoin 2013 | Columnist | Insights & Charts, Not Financial Advice πŸš«πŸ“‰

ID: 843478255571296256

calendar_today19-03-2017 15:04:22

1,1K Tweet

513 Followers

1,1K Following

Mark Gough (@techchartmark) 's Twitter Profile Photo

#SPX is showing signs of a pattern similar to Summer '23. After breaking below the 50-day MA and VWAP, it's now tested the 100 MA just as on August 18 2023. A close above the VWAP could push targets to 5065/5148/C point. Key support at 4900. #MarketAnalysis Harmonic Trader

#SPX is showing signs of a pattern similar to Summer '23. After breaking below the 50-day MA and VWAP, it's now tested the 100 MA just as on August 18 2023. A close above the VWAP could push targets to 5065/5148/C point. Key support at 4900.  #MarketAnalysis <a href="/harmonictrader/">Harmonic Trader</a>
Mark Gough (@techchartmark) 's Twitter Profile Photo

#SPX strong move above the VWAP, first target hit 5065. needs a close above the 50 day ma at 5085 for continuation to next levels.

#SPX strong move above the VWAP, first target hit 5065. needs a close above the 50 day ma at 5085 for continuation to next levels.
Mark Gough (@techchartmark) 's Twitter Profile Photo

#BTC broke through the $63k target but bumped into heavy resistance at $73k, pulling back 20% for the 5th time from the lows at $15k. For now, bouncing around a great trading range between $60k-$73k. Four average 8k moves in this range so far. Right now, at midpoint channel

#BTC broke through the $63k target but bumped into heavy resistance at $73k, pulling back 20% for the 5th time from the lows at $15k. For now, bouncing around a great trading range between $60k-$73k. Four average 8k moves in this range so far. Right now, at midpoint channel
Mark Gough (@techchartmark) 's Twitter Profile Photo

#BBAI Bigbear.AI, a 70% drop from the top, may have found a bottom here. Harmonic Shark on the H4. A lot depends on the indexs and how things progress over the next 4-6 weeks. Lots of overhead resistance to overcome the 50-day ma at $2 for a start, we will look for

#BBAI Bigbear.AI, a 70% drop from the top, may have found a bottom here. Harmonic Shark on the H4. A lot depends on the indexs and how things progress over the next 4-6 weeks. Lots of overhead resistance to overcome the 50-day ma at $2 for a start, we will look for
Arthur Hayes (@cryptohayes) 's Twitter Profile Photo

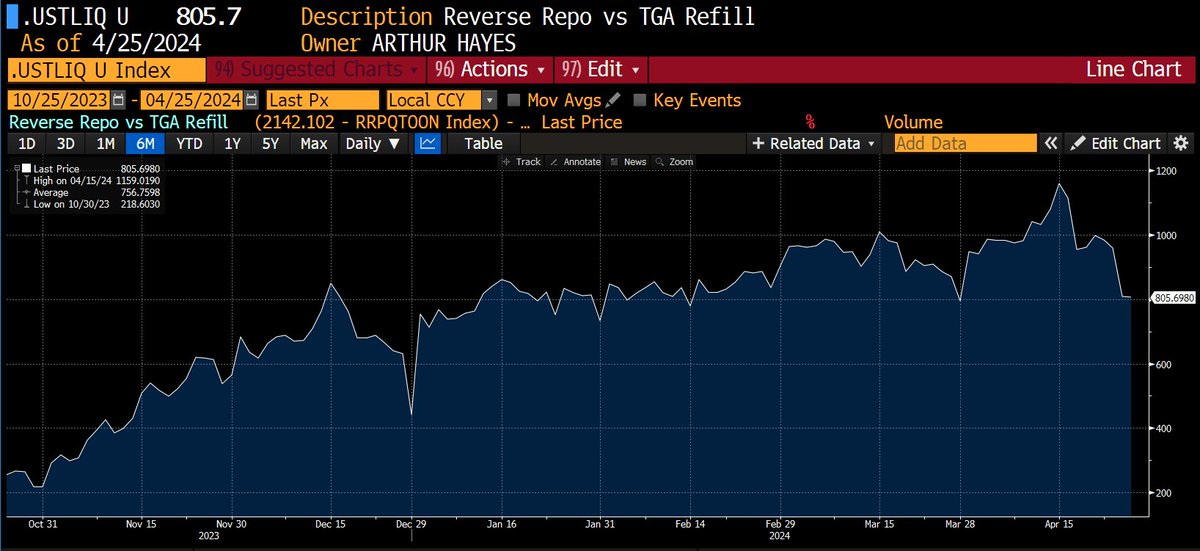
As expected tax receipts added roughly $200bn to TGA. Forget about the May Fed meeting the 2Q24 refunding annc comes out next week. What games will Yellen play, here are some options: 1. Stop issuing treasuries by running down the TGA to zero, that is a $1tn injection of

As expected tax receipts added roughly $200bn to TGA. Forget about the May Fed meeting the 2Q24 refunding annc comes out next week. What games will Yellen play, here are some options:

1. Stop issuing treasuries by running down the TGA to zero, that is a $1tn injection of
Mark Gough (@techchartmark) 's Twitter Profile Photo

$PAXG Pax Gold/BTC has achieved an impressive 66% gain within the current trading range, with our T1 target at 0.062732 BTC still in play. Looking back, from November 2021 to December 2022, PAXG gained over 330%. This period highlighted PAXG's potential as a great hedge against

$PAXG Pax Gold/BTC has achieved an impressive 66% gain within the current trading range, with our T1 target at 0.062732 BTC still in play.

Looking back, from November 2021 to December 2022, PAXG gained over 330%. This period highlighted PAXG's potential as a great hedge against
Mark Gough (@techchartmark) 's Twitter Profile Photo

#Bitcoin is currently in a weekly Shark pattern, suggesting a potential pullback to complete the 5-0 pattern. We could see a move towards the T1 zone at $45,703 - $43,000. Scott Carneys Harmonic Trader 5-0 Pattern: This pattern often follows the Shark pattern and indicates the

#Bitcoin is currently in a weekly Shark pattern, suggesting a potential pullback to complete the 5-0 pattern. We could see a move towards the T1 zone at $45,703 - $43,000.

Scott Carneys <a href="/harmonictrader/">Harmonic Trader</a> 5-0 Pattern: This pattern often follows the Shark pattern and indicates the
Mark Gough (@techchartmark) 's Twitter Profile Photo

🚨 Fetch AI (or ASI) Update 🚨 Fetch AI has seen an -80 % drop from its highs of $3.48 and now appears to be in a bottoming range, forming a classic Gartley pattern. Key Levels to Watch: Immediate Test: The price is likely to test at $1.00 - $1.18 soon. Accumulation Zone:

🚨 Fetch AI (or ASI) Update 🚨

Fetch AI has seen an -80 % drop from its highs of $3.48 and now appears to be in a bottoming range, forming a classic Gartley pattern. 

Key Levels to Watch:

Immediate Test: The price is likely to test at $1.00 - $1.18 soon. 

Accumulation Zone: