Zack Labe(@ZLabe) 's Twitter Profileg
Zack Labe

@ZLabe

Climate Scientist (Atmospheric) PhD | Postdoc at @Princeton and @NOAA_GFDL | Sharing data-driven stories | He/Him | Views my own

ID:344395626

linkhttps://zacklabe.com/ calendar_today29-07-2011 00:38:24

28,0K Tweets

66,0K Followers

1,1K Following

Follow People
British Antarctic Survey 🐧(@BAS_News) 's Twitter Profile Photo

You’ve heard about Antarctic sea ice lows - well, here’s the consequences.

Over 9,000 emperor penguin chicks from colonies in the Bellingshausen Sea are thought to have died in November 2022.

The sea ice they lived on broke up early, before they'd developed waterproof feathers.

account_circle
Zack Labe(@ZLabe) 's Twitter Profile Photo

Record high melt event for this time of year is currently ongoing over the Greenland Ice Sheet...

Explore using National Snow and Ice Data Center data at nsidc.org/greenland-toda….

account_circle
Zack Labe(@ZLabe) 's Twitter Profile Photo

Due to unusually low sea ice in both poles (especially the Antarctic), global sea ice levels continue to remain well below the previous satellite-era record for late August...

More sea ice graphics available at zacklabe.com/global-sea-ice…

Due to unusually low sea ice in both poles (especially the Antarctic), global sea ice levels continue to remain well below the previous satellite-era record for late August... More sea ice graphics available at zacklabe.com/global-sea-ice…
account_circle
Zack Labe(@ZLabe) 's Twitter Profile Photo

Temperature anomalies over the last month (left), 3 months (center), and 12 months (right) in the Northern Hemisphere...

Data from Copernicus ECMWF ERA5 reanalysis at cds.climate.copernicus.eu/cdsapp#!/datas…
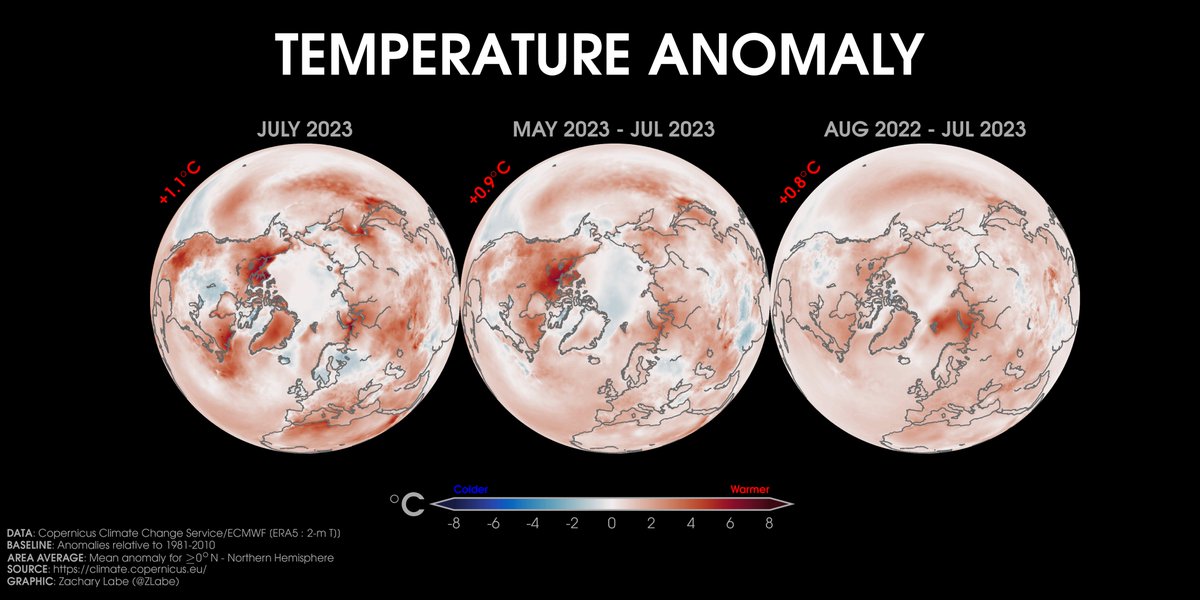
Temperature anomalies over the last month (left), 3 months (center), and 12 months (right) in the Northern Hemisphere... Data from @CopernicusECMWF ERA5 reanalysis at cds.climate.copernicus.eu/cdsapp#!/datas…
account_circle
Zack Labe(@ZLabe) 's Twitter Profile Photo

Latest 'cloud-free' mosaic from MODIS satellite imagery showing the lack of sea ice and thus greater areal coverage of open water (compared to past decades). Note also the large phytoplankton bloom and drifting wildfire smoke.

Imagery from ice-glaces.ec.gc.ca/cgi-bin/getpro…

Latest 'cloud-free' mosaic from MODIS satellite imagery showing the lack of #Arctic sea ice and thus greater areal coverage of open water (compared to past decades). Note also the large phytoplankton bloom and drifting wildfire smoke. Imagery from ice-glaces.ec.gc.ca/cgi-bin/getpro…
account_circle
Zack Labe(@ZLabe) 's Twitter Profile Photo

Simulated reconstruction of August sea ice thickness since 1901. Interannual variability and an obvious decrease in recent years.

Information about this data set is available at doi.org/10.1175/JCLI-D…. Note that it is only updated through 2010 due to ERA-20C forcing.

account_circle
Zack Labe(@ZLabe) 's Twitter Profile Photo

Last month observed the largest temperature anomalies across the tropics (El Niño) and Northern Hemisphere midlatitude region...

[Plot shows zonal-mean surface air temperature anomalies (1951-1980 baseline), where latitude = x-axis (not scaled by distance). Data from GISTEMPv4]

Last month observed the largest temperature anomalies across the tropics (El Niño) and Northern Hemisphere midlatitude region... [Plot shows zonal-mean surface air temperature anomalies (1951-1980 baseline), where latitude = x-axis (not scaled by distance). Data from GISTEMPv4]
account_circle
Zack Labe(@ZLabe) 's Twitter Profile Photo

Same situation for the Southern Hemisphere mean - record hot July too

[Data/methods: data.giss.nasa.gov/gistemp/faq/]

Same situation for the Southern Hemisphere mean - record hot July too [Data/methods: data.giss.nasa.gov/gistemp/faq/]
account_circle
Ed Hawkins(@ed_hawkins) 's Twitter Profile Photo

This 'ensemble boosting' approach is a really helpful way of demonstrating what a 'worst-case' weather event might look like for a particular region.
It also shows that climate models can reproduce the size of recent record shattering extremes in the current climate.

account_circle
John Kennedy(@micefearboggis) 's Twitter Profile Photo

The climate dashboard and dashboard of dashboards dashboard has a new dashboard or two. Zack Labe's amazing webpage and the @UCL Climate change in numbers page.

jjk-code-otter.github.io/dashboard-dash…

The climate dashboard and dashboard of dashboards dashboard has a new dashboard or two. @ZLabe's amazing webpage and the @UCL Climate change in numbers page. jjk-code-otter.github.io/dashboard-dash…
account_circle
Zack Labe(@ZLabe) 's Twitter Profile Photo

100 years of average May to July temperature anomalies over land areas - there is relative warmth practically everywhere by the end of the animation.

[Data from data.giss.nasa.gov/gistemp/; some missing data prior to ~1960, especially over the Antarctic, which is shaded black]

account_circle
Zack Labe(@ZLabe) 's Twitter Profile Photo

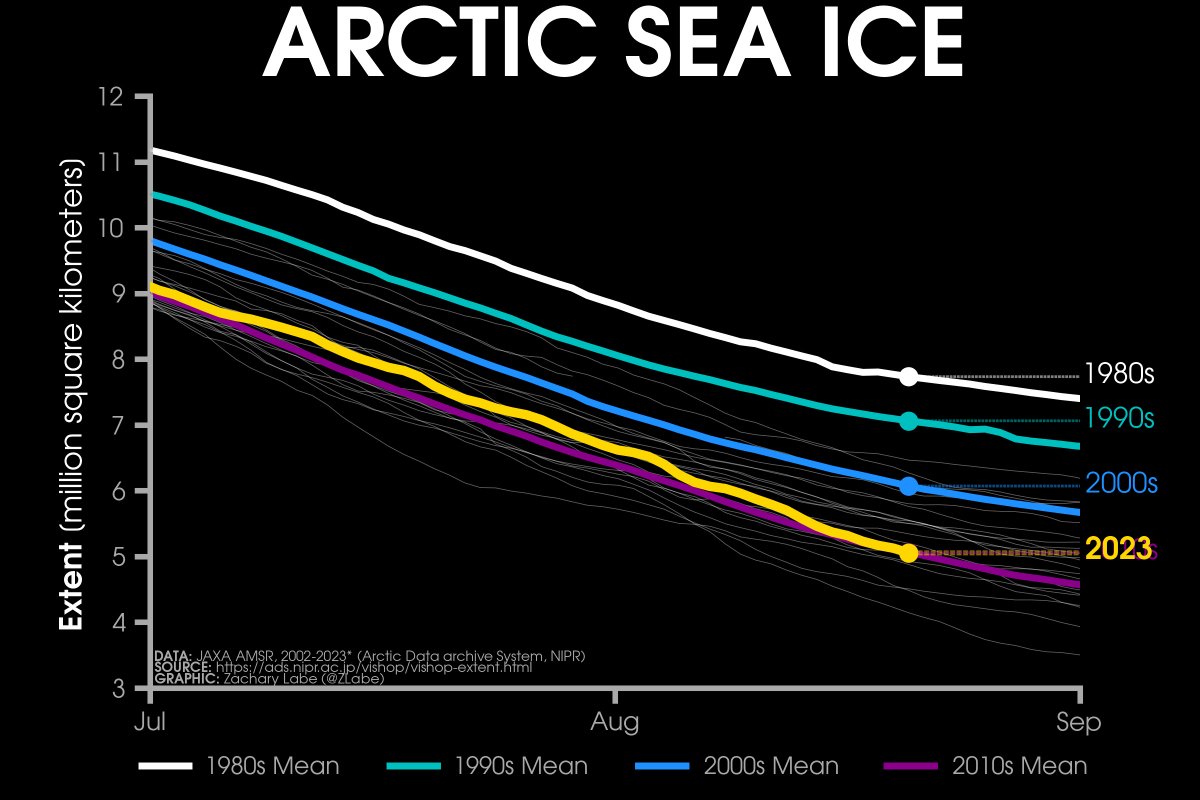
sea ice extent is currently the 6th lowest on record (JAXA data)

• about 3,000 km² below the 2010s mean
• about 1,020,000 km² below the 2000s mean
• about 2,010,000 km² below the 1990s mean
• about 2,680,000 km² below the 1980s mean

Plots: zacklabe.com/arctic-sea-ice…

#Arctic sea ice extent is currently the 6th lowest on record (JAXA data) • about 3,000 km² below the 2010s mean • about 1,020,000 km² below the 2000s mean • about 2,010,000 km² below the 1990s mean • about 2,680,000 km² below the 1980s mean Plots: zacklabe.com/arctic-sea-ice…
account_circle
Will Stancil(@whstancil) 's Twitter Profile Photo

Less than a year ago Twitter was the best source of on-the-ground reports during a disaster. Now searching for anything related to Hilary just produces an incomprehensible pile of fake videos and claims, all laundered to the top of search results with meaningless blue checks

account_circle
Zack Labe(@ZLabe) 's Twitter Profile Photo

Trends in August air temperatures show greater warming around the perimeter of the Ocean, especially in the Kara Sea, Laptev Sea, and Canadian Arctic Archipelago regions.

[Data from Copernicus ECMWF ERA5 reanalysis; more info: doi.org/10.1175/BAMS-D…]

Trends in August air temperatures show greater warming around the perimeter of the #Arctic Ocean, especially in the Kara Sea, Laptev Sea, and Canadian Arctic Archipelago regions. [Data from @CopernicusECMWF ERA5 reanalysis; more info: doi.org/10.1175/BAMS-D…]
account_circle
Zack Labe(@ZLabe) 's Twitter Profile Photo

Join me in tracking this year's sea ice minimum!

Sea ice melt substantially slows every September as solar energy decreases and temperatures drop.

No new records are likely this year for the minimum. Follow along at zacklabe.com/arctic-sea-ice…

Join me in tracking this year's #Arctic sea ice minimum! Sea ice melt substantially slows every September as solar energy decreases and temperatures drop. No new records are likely this year for the minimum. Follow along at zacklabe.com/arctic-sea-ice…
account_circle
Zack Labe(@ZLabe) 's Twitter Profile Photo

July 2023 data is now available from GIOMAS for Antarctic sea-ice thickness/volume (zacklabe.com/antarctic-sea-…) and global sea-ice volume (zacklabe.com/global-sea-ice…).

account_circle
Zack Labe(@ZLabe) 's Twitter Profile Photo

Last month's temperatures across the Northern Hemisphere were not even close to the previous record.

[Data/methods: data.giss.nasa.gov/gistemp/faq/]

Last month's temperatures across the Northern Hemisphere were not even close to the previous record. [Data/methods: data.giss.nasa.gov/gistemp/faq/]
account_circle
Zack Labe(@ZLabe) 's Twitter Profile Photo

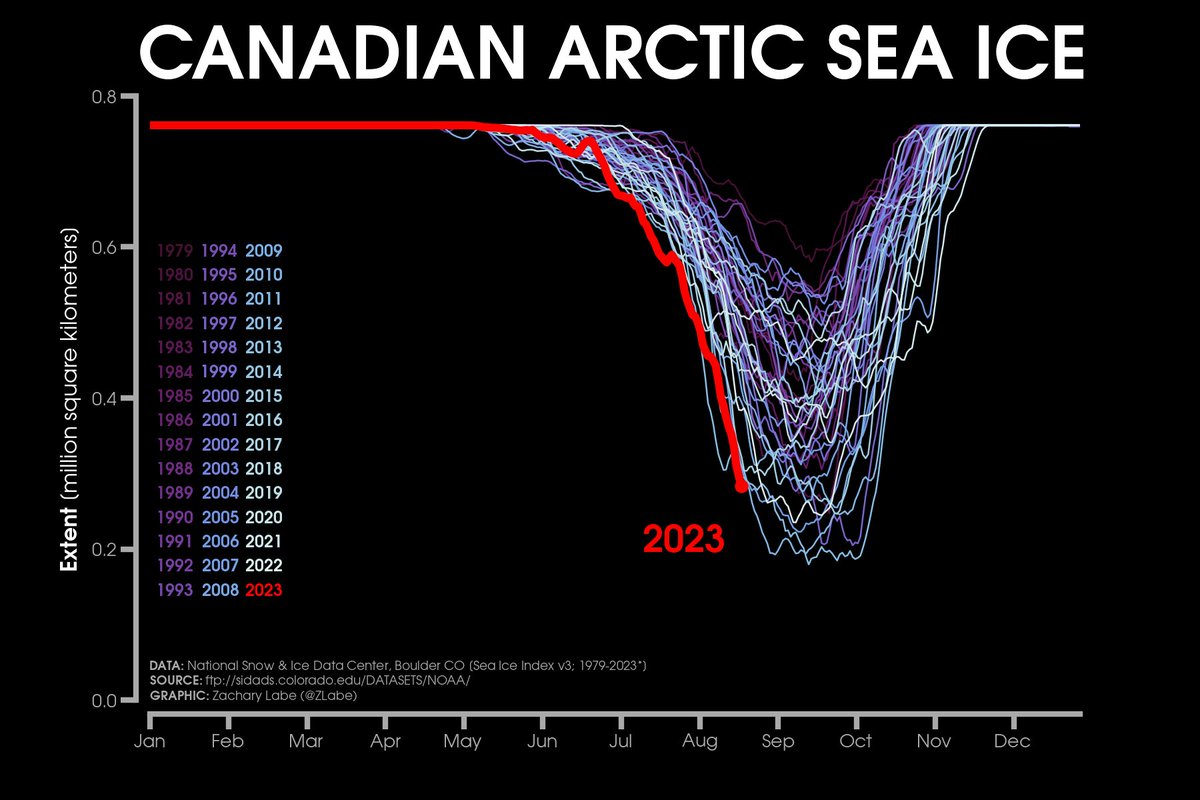
One area of the observing unusually low sea ice is across the Canadian Archipelago region, which is at record low levels for this time of year...

Data from National Snow and Ice Data Center.

One area of the #Arctic observing unusually low sea ice is across the Canadian Archipelago region, which is at record low levels for this time of year... Data from @NSIDC.
account_circle