Topi Tjukanov
@tjukanov
Makes maps. Works at @Mapbox. Started #30DayMapChallenge.
ID:2198358416
https://tjukanov.org/ 16-11-2013 20:21:07
9,6K Tweets
20,9K Followers
2,4K Following

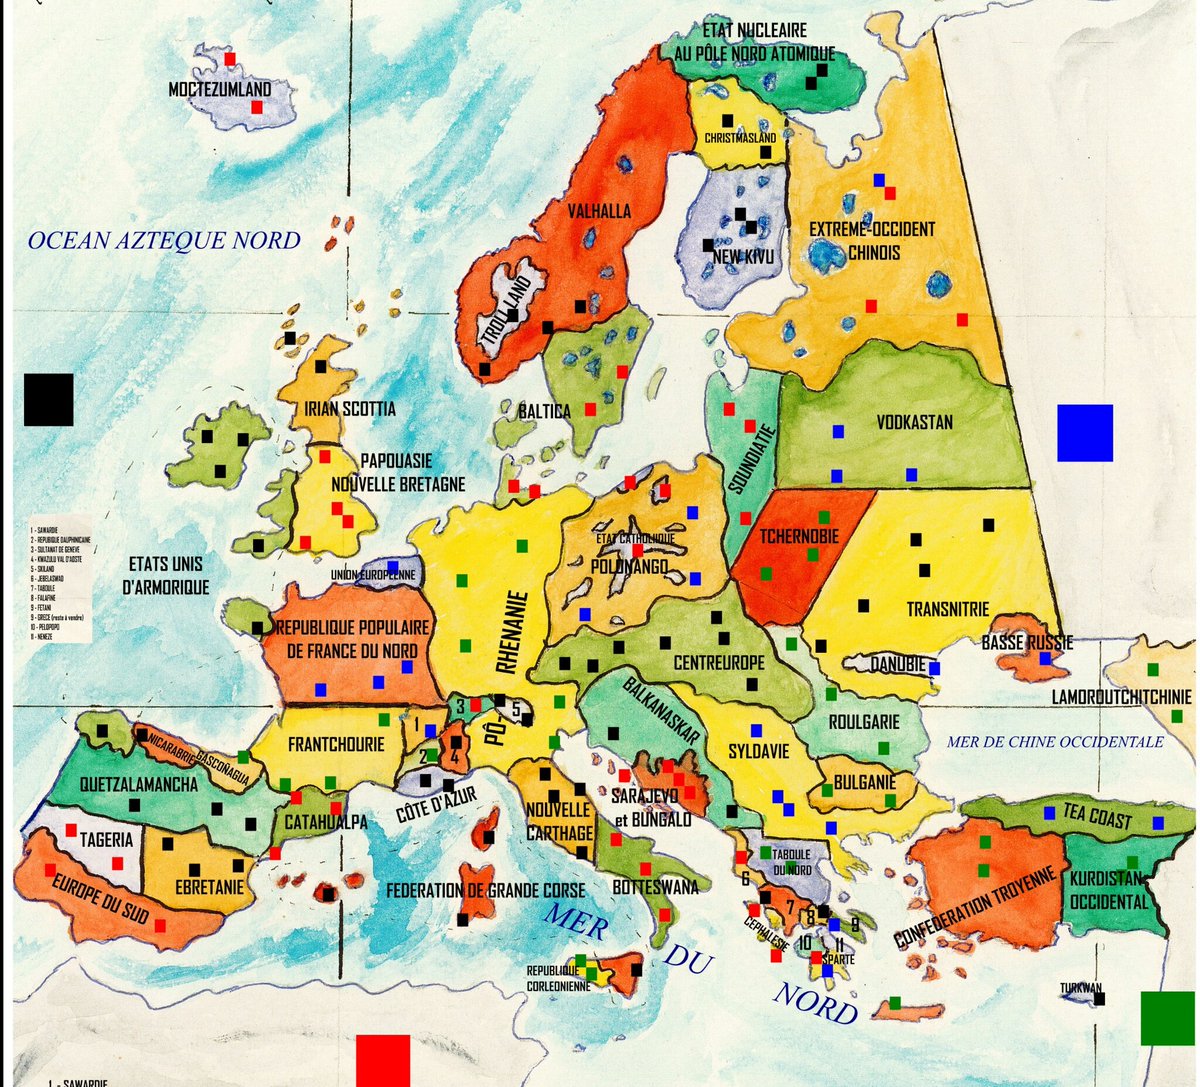
#30DayMapChallenge jour 3 : polygones. Une Europe dystopique (sous forme de plateau de risk), ses frontières et états issus des colonisations aztèque, malienne, chinoise, etc...un autre monde eût été possible.

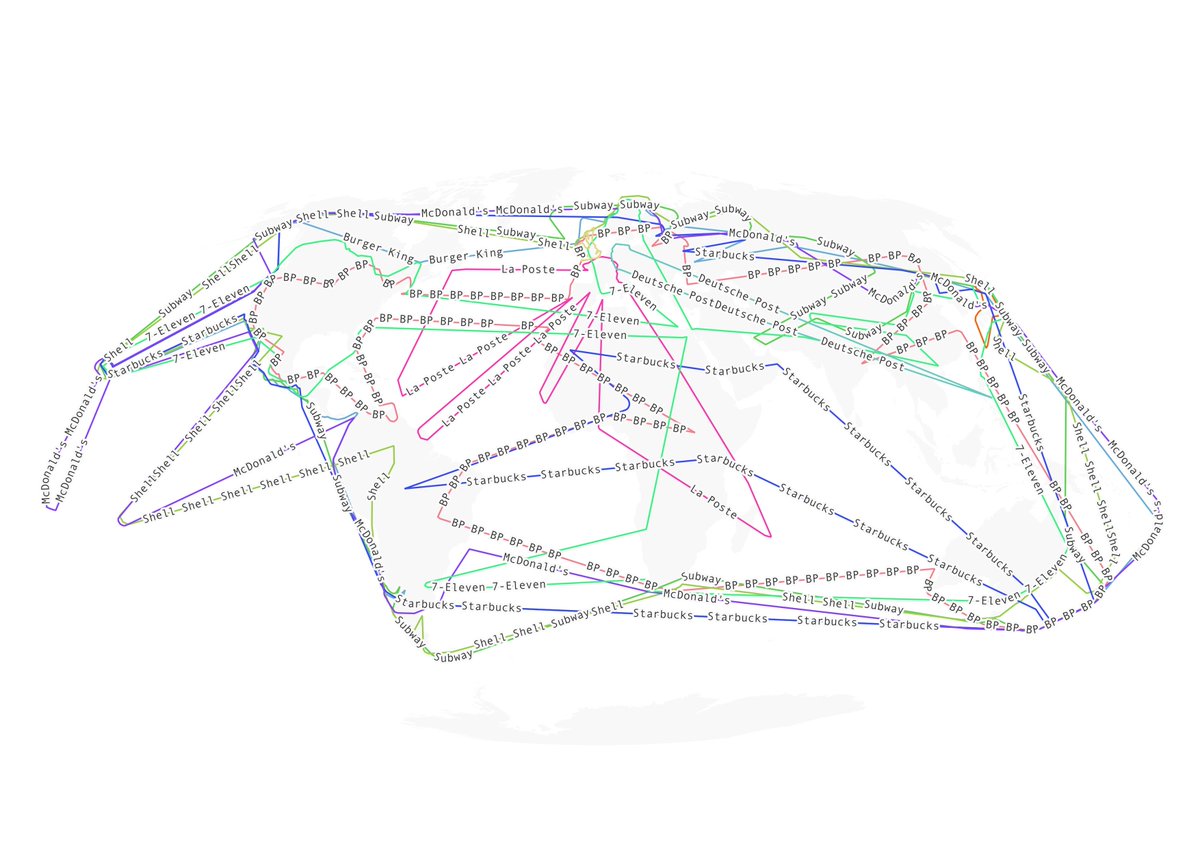
Concave hulls for brands with more than 10 000 features in OpenStreetMap.
Data: OpenStreetMap contributors. Made with QGIS.
#30DayMapChallenge day 3: polygons


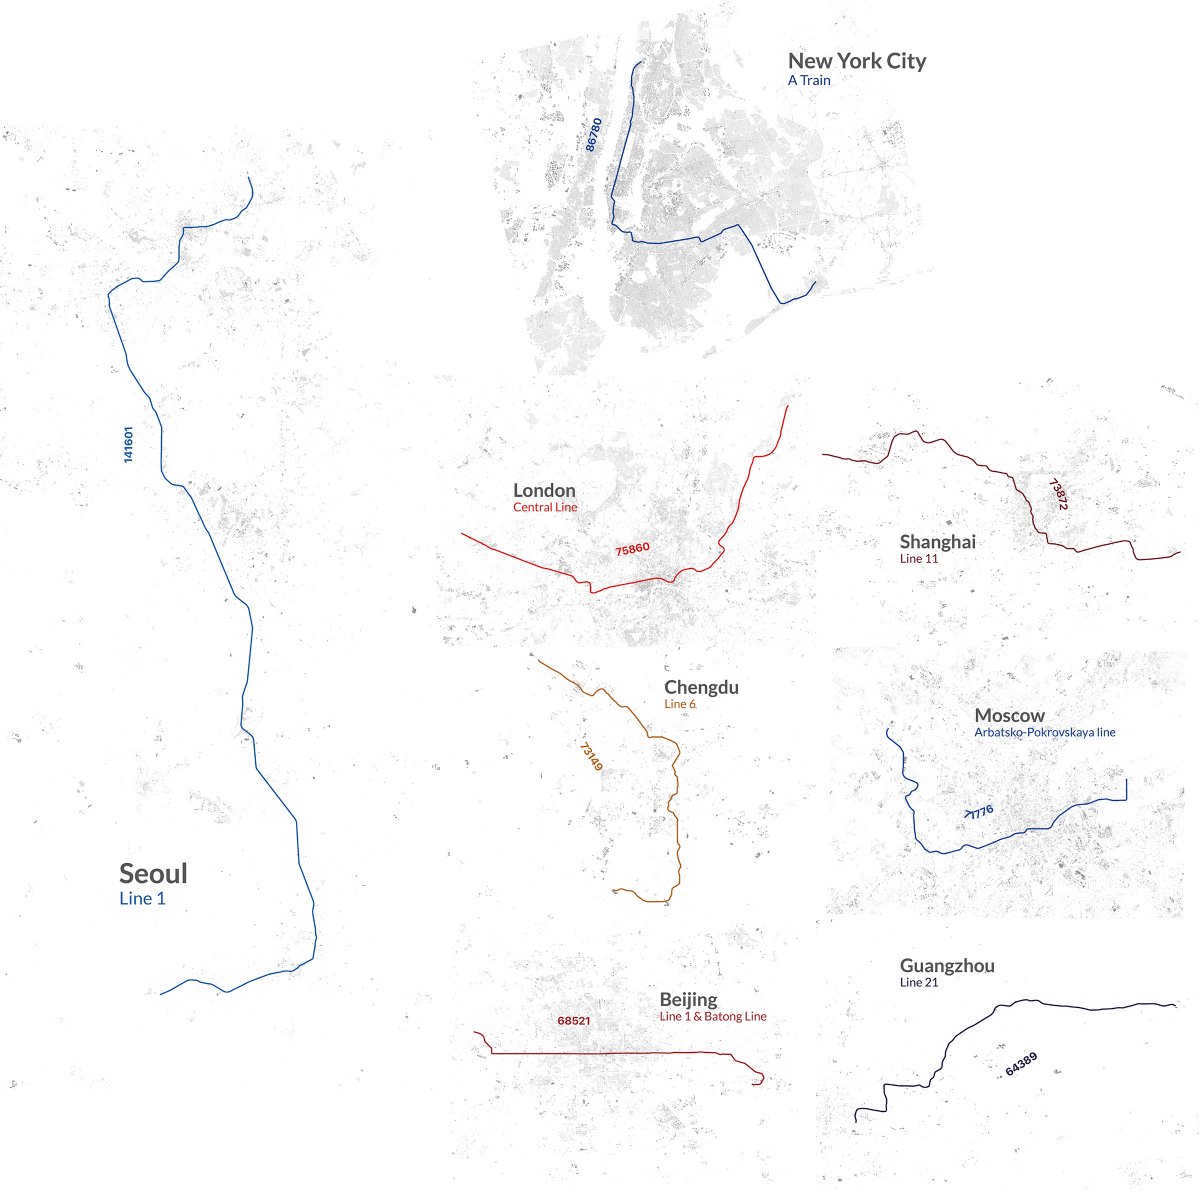
#30DayMapChallenge Day 2: Lines
Some of the world's longest subway lines (on uniform scale).
Data: OSM

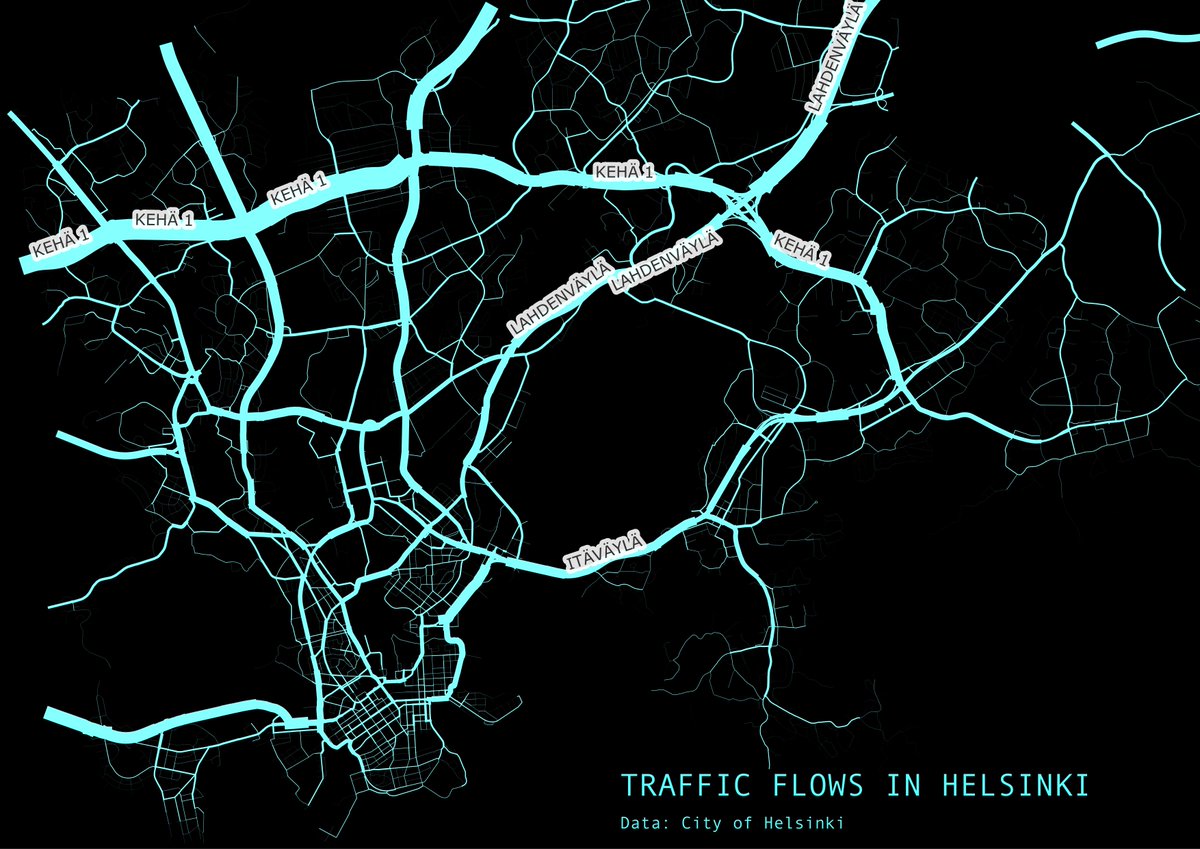
Roads in Helsinki. Width relative to average number of daily car traffic.
#30DayMapChallenge Day 2: Lines.

#30daymapchallenge
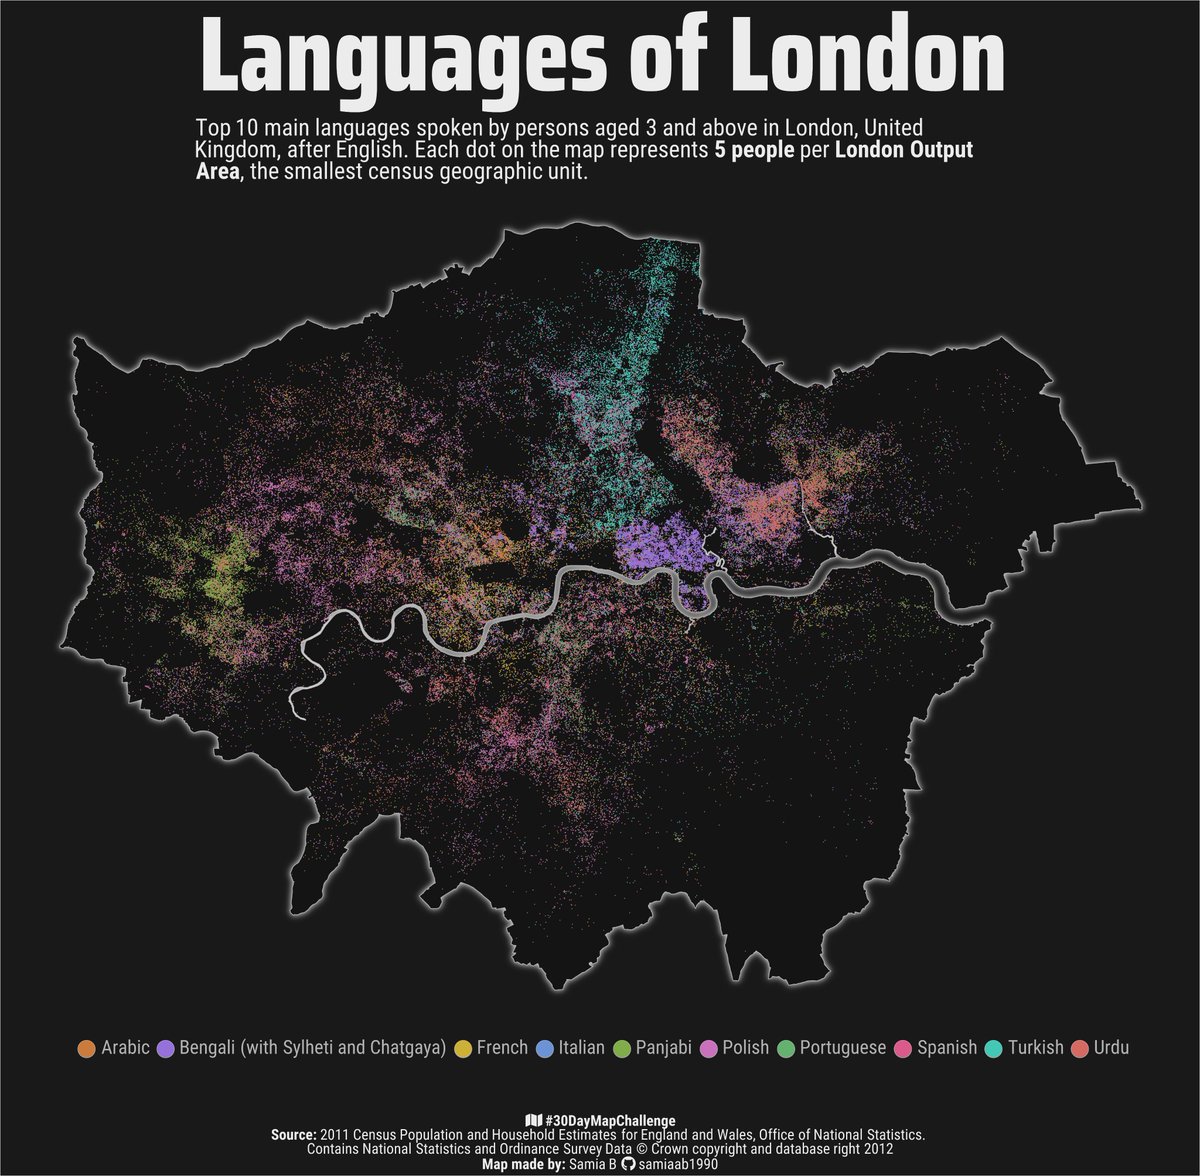
Day 1: Points
a dot density map of the top 10 languages spoken in the London, UK. There are over 150,000 points on the map! each point = 5 people
made using #RStats
#DataVisualization #DataViz #DataScience #GIS #maps


Excellent maps have come out of #30DayMapChallenge , but please don't feel bad for not participating. Not everyone is doing it, I did it once and life is better just watching the outcomes

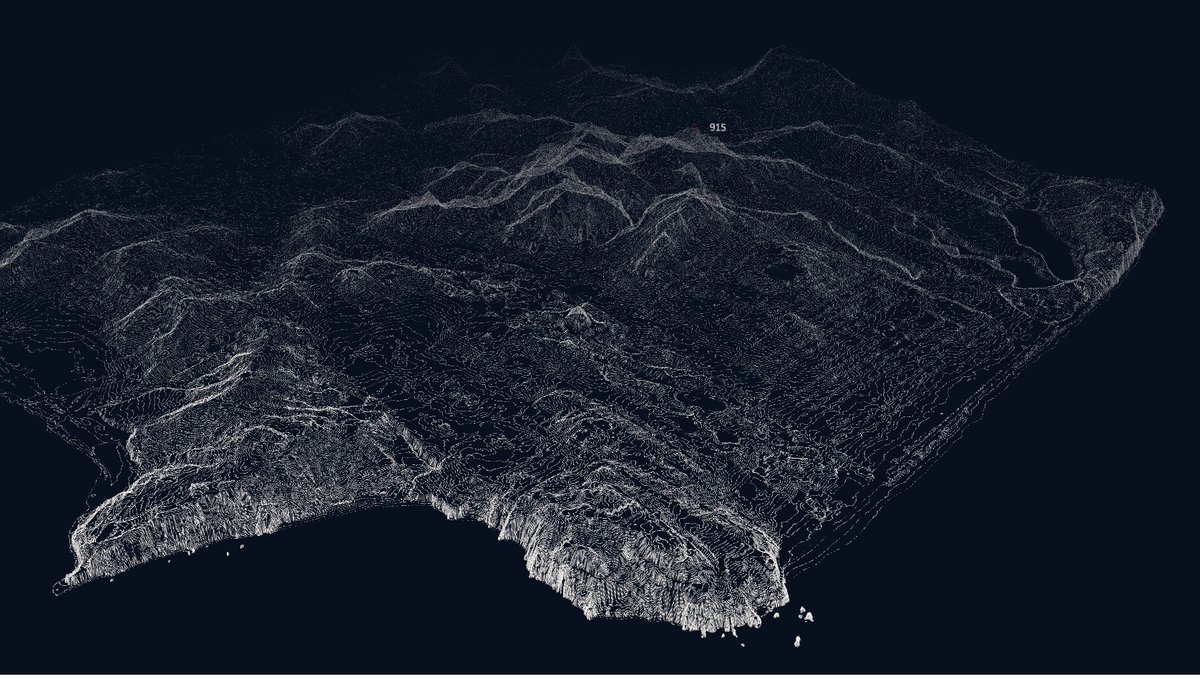
For #30DayMapChallenge I thought I'd start with a dataset I enjoy playing with, SF Elevation Contours. I rendered it as points (day 1!) in Foursquare Studio. The highest point in SF is annotated.

#30DayMapChallenge Day 1: Points representing windfarms around the globe. Point size == capacity.
tjukanovt.github.io/windfarms
Data: Global Wind Power Tracker, Global Energy Monitor, May 2022 release
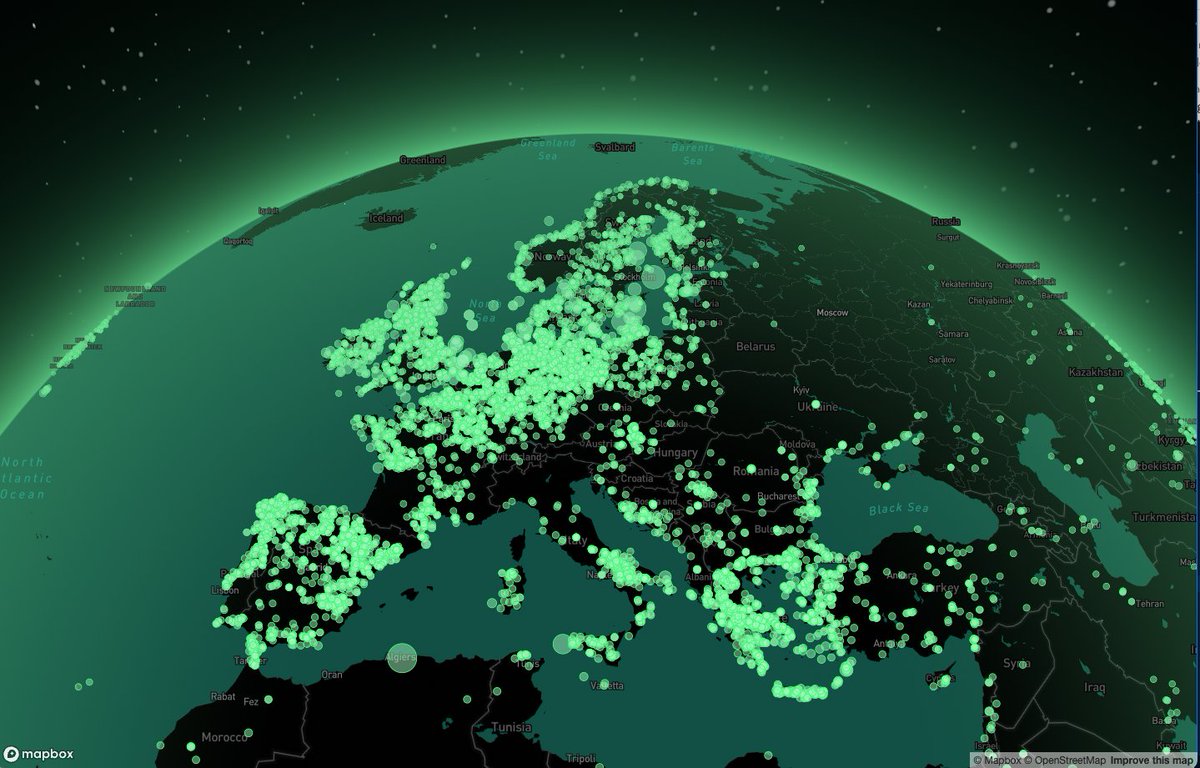

Day 1 of #30DayMapChallenge - Points
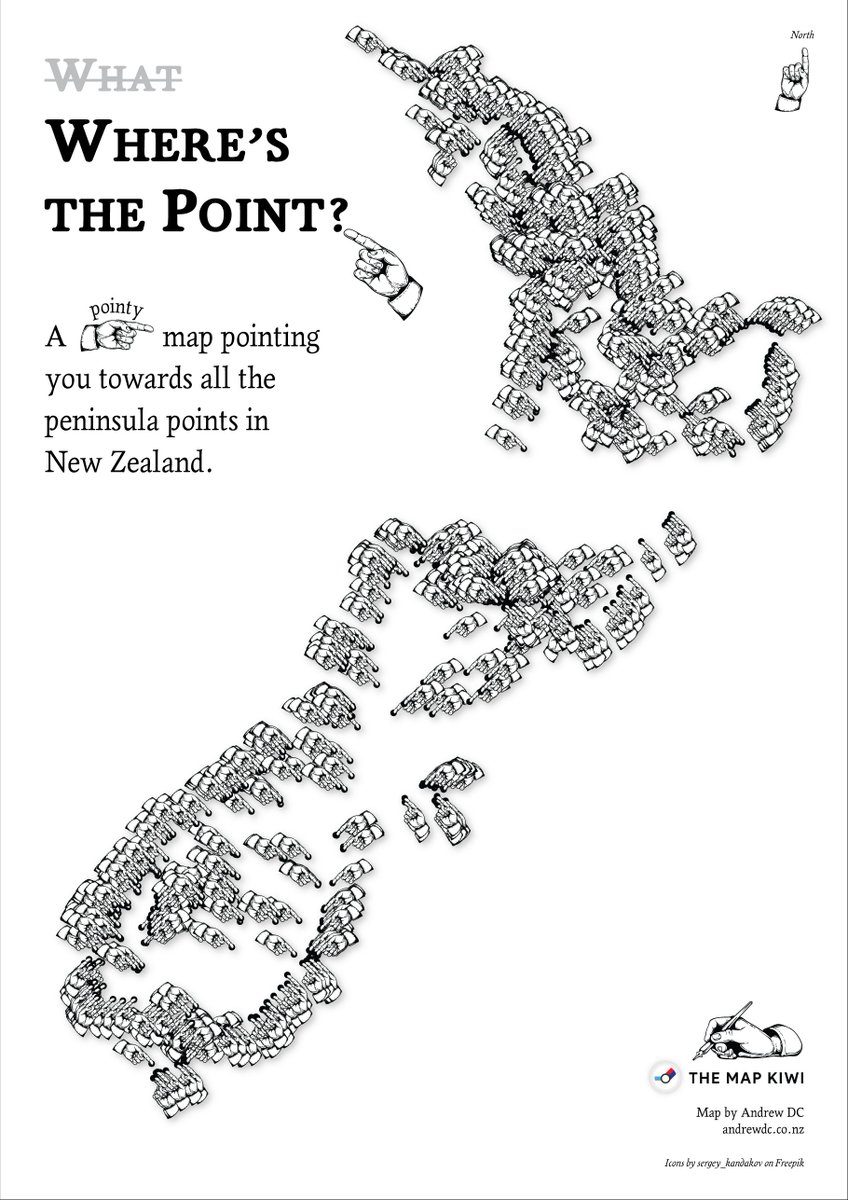
A 👉 map pointing you to all the peninsula points in New Zealand.


Me at beginning of the month: If I start early, I can definitely do all 30 maps for #30daymapchallenge !
Me now looking at November only a few days away: ......oh yeah, this is going to be harder than I thought.
