NOAA Climate.gov(@NOAAClimate) 's Twitter Profileg
NOAA Climate.gov

@NOAAClimate

Toward a Climate-Smart Nation. The official @NOAA account hosted by the Climate Program Office. Follow for #climate news, #science, #data, resources, and more!

ID:552985513

linkhttp://www.climate.gov calendar_today13-04-2012 20:23:11

14,4K Tweets

122,9K Followers

389 Following

Follow People
NOAA Climate.gov(@NOAAClimate) 's Twitter Profile Photo

is on the prowl in the tropical Pacific. How loud do forecasters think it's going to roar? How will the record-warm oceans affect things? Read our latest blog for more! climate.gov/news-features/…

#ElNiño is on the prowl in the tropical Pacific. How loud do forecasters think it's going to roar? How will the record-warm oceans affect things? Read our latest #ENSO blog for more! climate.gov/news-features/…
account_circle
NOAA Climate.gov(@NOAAClimate) 's Twitter Profile Photo

According to yesterday's Sept climate summary from NOAA NCEI, the area in the CONUS affected by drought grew nearly 6% in Sept, reaching ~40%. Severe to exceptional drought was widespread across the Southwest, Deep South, Plains, and PacNW as of Oct. 3

According to yesterday's Sept climate summary from @NOAANCEI, the area in the CONUS affected by drought grew nearly 6% in Sept, reaching ~40%. Severe to exceptional drought was widespread across the Southwest, Deep South, Plains, and PacNW as of Oct. 3
account_circle
NOAA Climate.gov(@NOAAClimate) 's Twitter Profile Photo

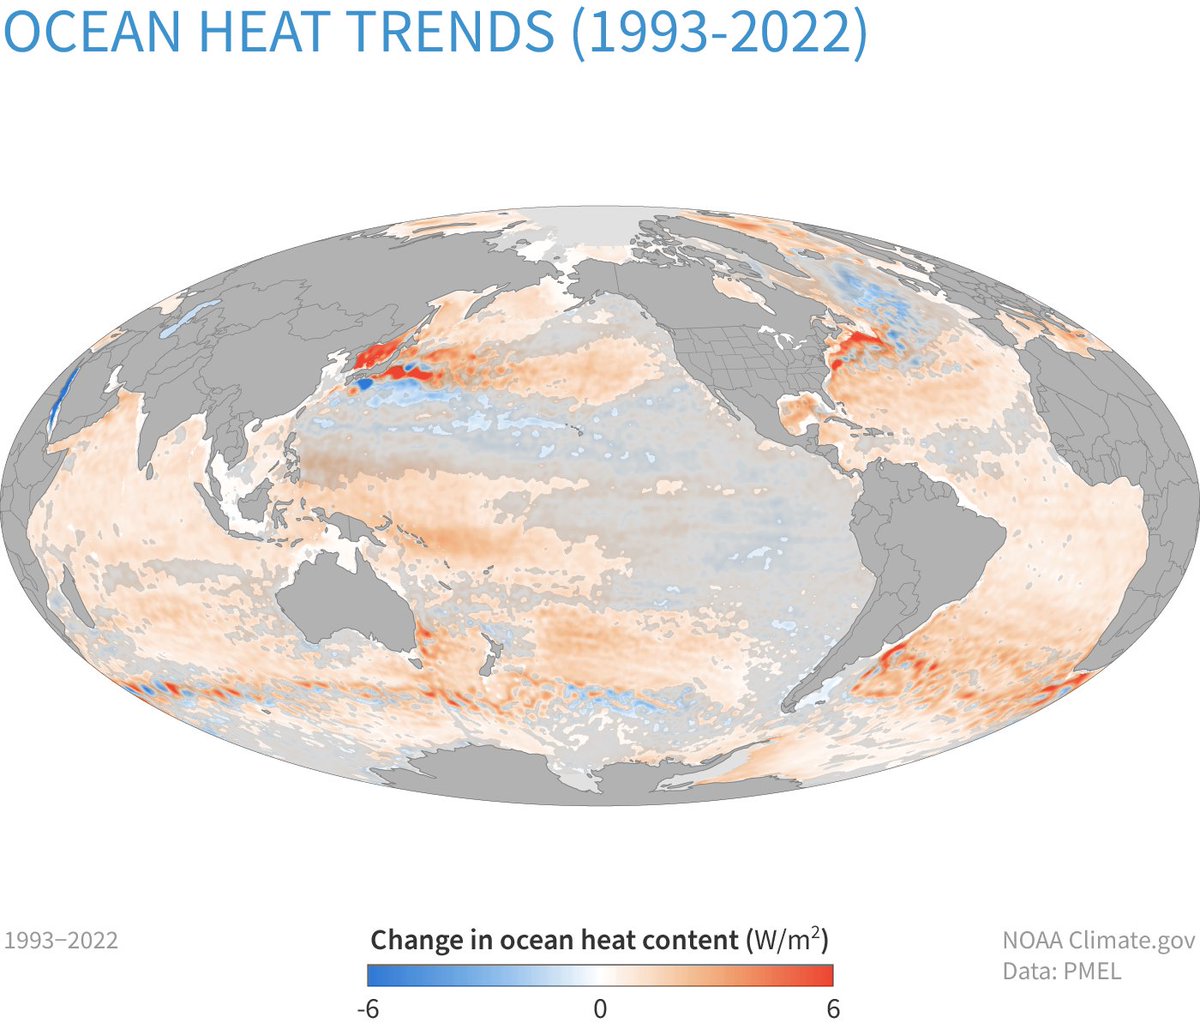
ICYMI: content in parts of the upper 2,300 feet of the rose by up to 6 Watts per square meter from 1993-2022 (dark orange). Some areas lost heat (blue). Changes in areas shaded gray were small relative to the range of natural variability. shorturl.at/wGST7

ICYMI: #Heat content in parts of the upper 2,300 feet of the #ocean rose by up to 6 Watts per square meter from 1993-2022 (dark orange). Some areas lost heat (blue). Changes in areas shaded gray were small relative to the range of natural variability. shorturl.at/wGST7
account_circle
NOAA Climate.gov(@NOAAClimate) 's Twitter Profile Photo

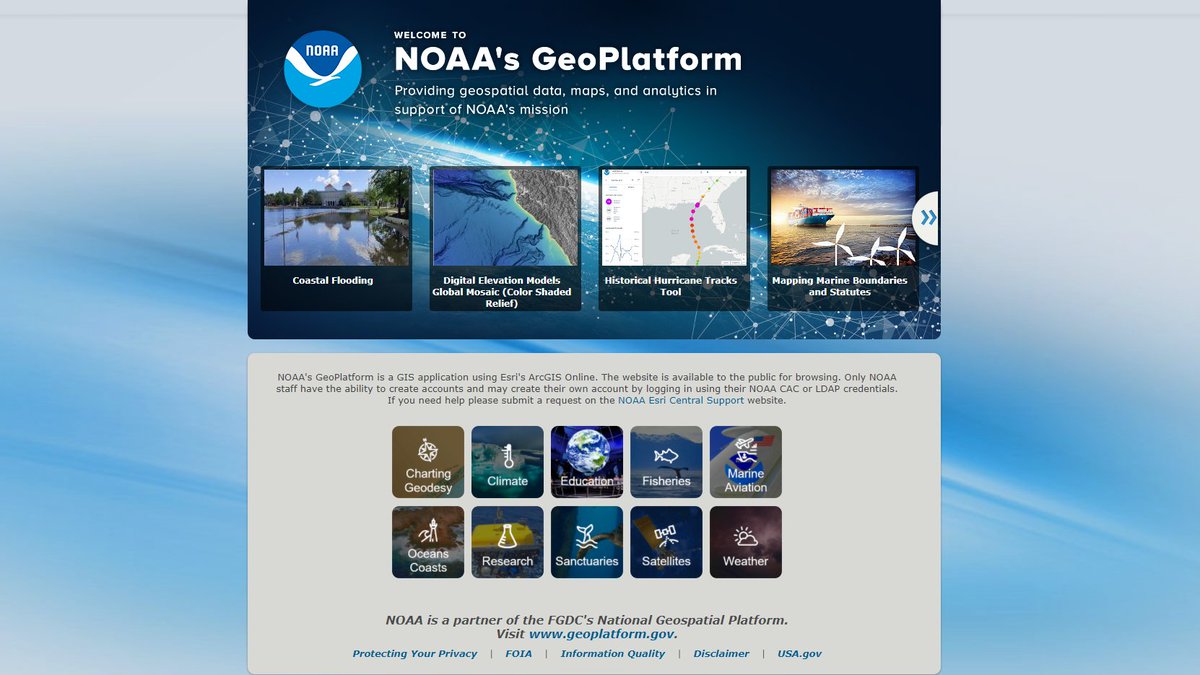
Are you looking for maps, layers, scenes, apps, and StoryMaps? NOAA's Geoplatform provides geospatial data, maps, and analytics in support of NOAA's mission through a GIS application using Esri's ArcGIS Online. Learn more: climate.gov/maps-data/data…

Are you looking for maps, layers, scenes, apps, and StoryMaps? NOAA's Geoplatform provides geospatial data, maps, and analytics in support of NOAA's mission through a GIS application using Esri's ArcGIS Online. Learn more: climate.gov/maps-data/data…
account_circle
NOAA Climate.gov(@NOAAClimate) 's Twitter Profile Photo

Are you new to climate data? This site will walk you through some of the basics to help you understand and explore climate data: climate.gov/maps-data/clim…

account_circle
NOAA Climate.gov(@NOAAClimate) 's Twitter Profile Photo

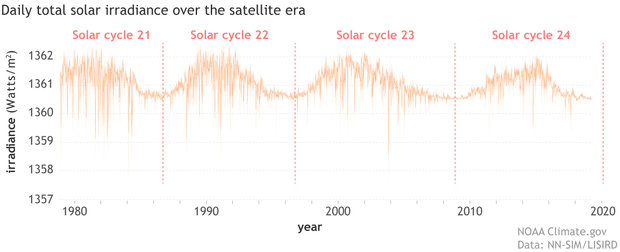
The Sun's overall brightness varies on timescales from minutes to millennia, and these changes are detectable in the global temperature record. Read more: climate.gov/news-features/…

The Sun's overall brightness varies on timescales from minutes to millennia, and these changes are detectable in the global temperature record. Read more: climate.gov/news-features/…
account_circle
CLEAN(@ClimateLit) 's Twitter Profile Photo

Next week is !

American Geosciences Institute has been organizing this event since 1998, encouraging stewardship of the Earth🌎 This year's theme is 'Geoscience Innovating for Earth and People.'

You can find the toolkit on AGI's website: earthsciweek.org/materials

Next week is #EarthScienceWeek! @AGI_Updates has been organizing this event since 1998, encouraging stewardship of the Earth🌎 This year's theme is 'Geoscience Innovating for Earth and People.' You can find the toolkit on AGI's website: earthsciweek.org/materials
account_circle
Northeast RCC(@NortheastRCC) 's Twitter Profile Photo

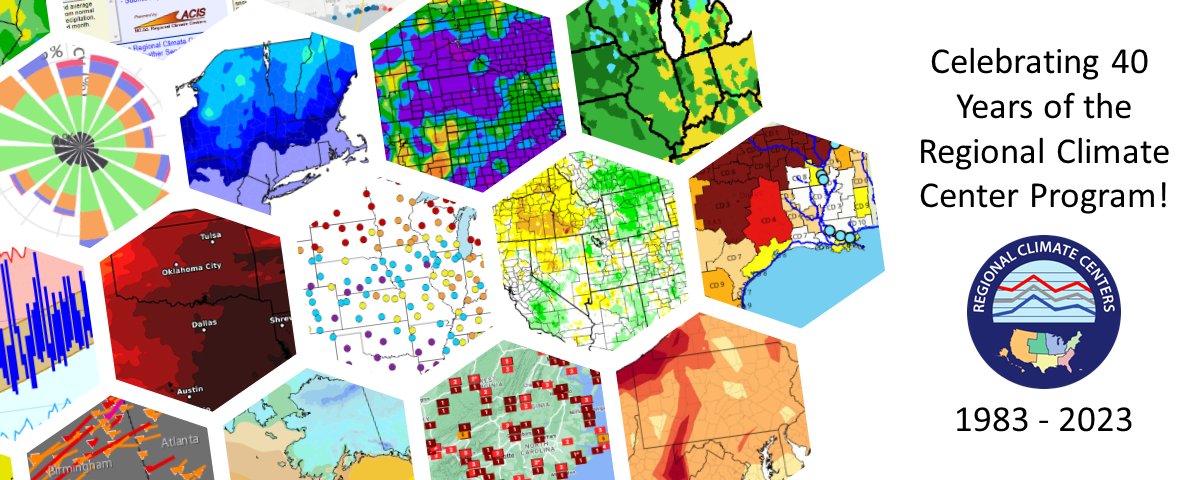
ICYMI: The RCC Program celebrated its 40th anniversary in September! Learn about our history and partnerships, how we supply data for decision-making, and explore some of our premier tools and products with the links featured here: ncei.noaa.gov/taxonomy/tags/…

ICYMI: The RCC Program celebrated its 40th anniversary in September! Learn about our history and partnerships, how we supply data for decision-making, and explore some of our premier tools and products with the links featured here: ncei.noaa.gov/taxonomy/tags/…
account_circle
NOAA Climate.gov(@NOAAClimate) 's Twitter Profile Photo

A record-high 22 Degree Heating Weeks (DHW) occurred this summer across the Florida Keys, nearly tripling the previous record and causing unprecedented coral bleaching. Read what NOAA scientists have been doing to help the corals: climate.gov/news-features/…

A record-high 22 Degree Heating Weeks (DHW) occurred this summer across the Florida Keys, nearly tripling the previous record and causing unprecedented coral bleaching. Read what NOAA scientists have been doing to help the corals: climate.gov/news-features/…
account_circle
NOAA Climate.gov(@NOAAClimate) 's Twitter Profile Photo

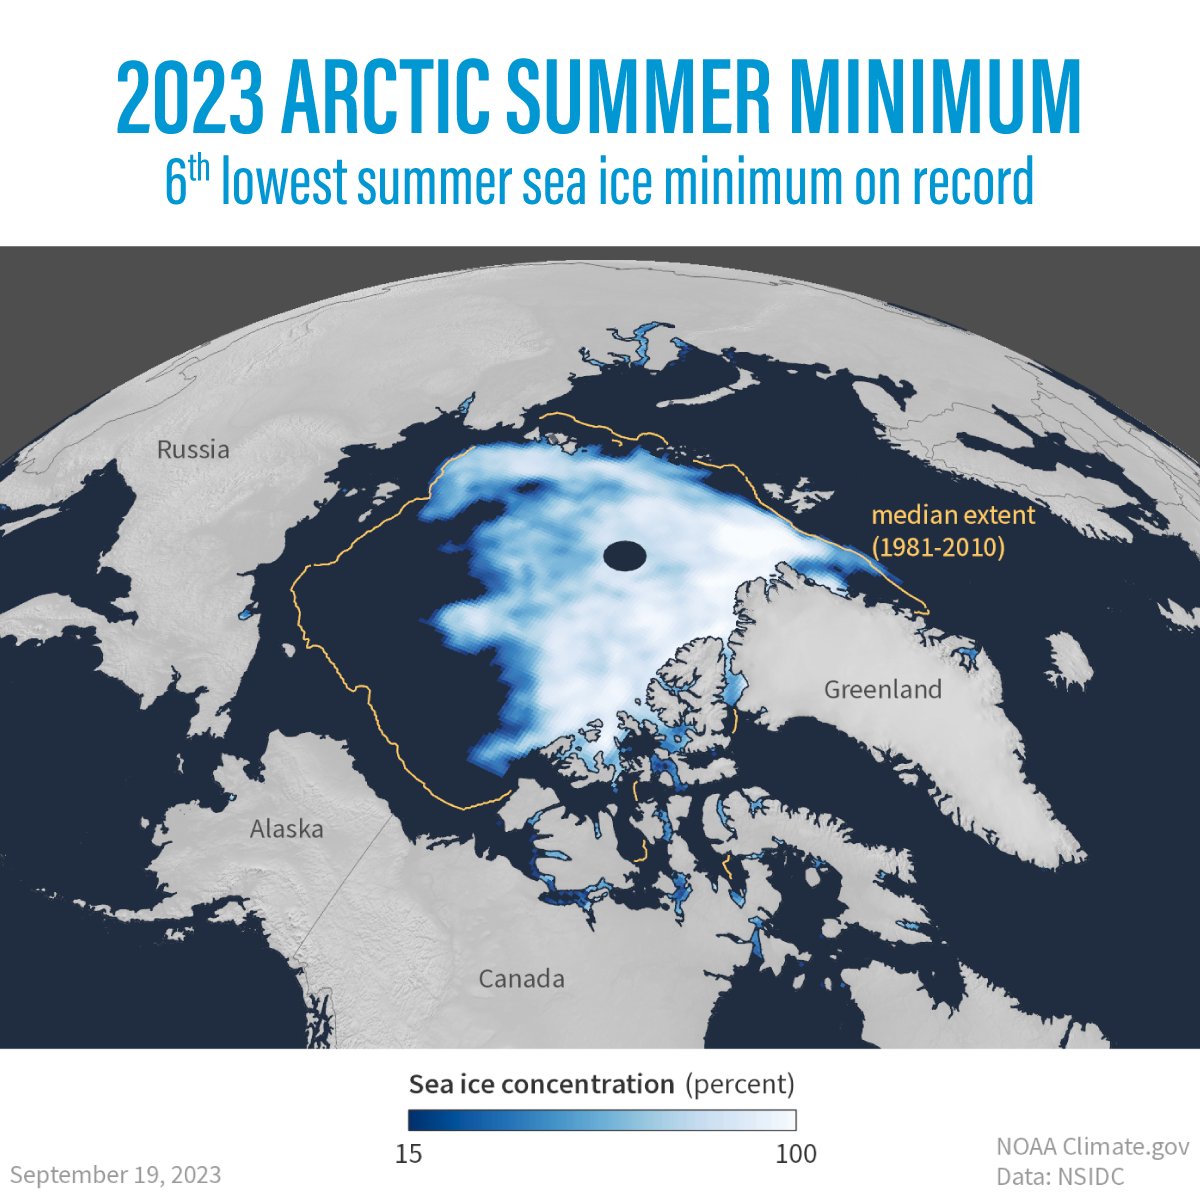
On September 19, Arctic sea ice reached its annual minimum extent however, with significant patches of low ice concentration a late season storm may compress the sea ice and push the ice extent lower. Read more: climate.gov/news-features/…

On September 19, Arctic sea ice reached its annual minimum extent however, with significant patches of low ice concentration a late season storm may compress the sea ice and push the ice extent lower. Read more: climate.gov/news-features/…
account_circle
NOAA Climate.gov(@NOAAClimate) 's Twitter Profile Photo

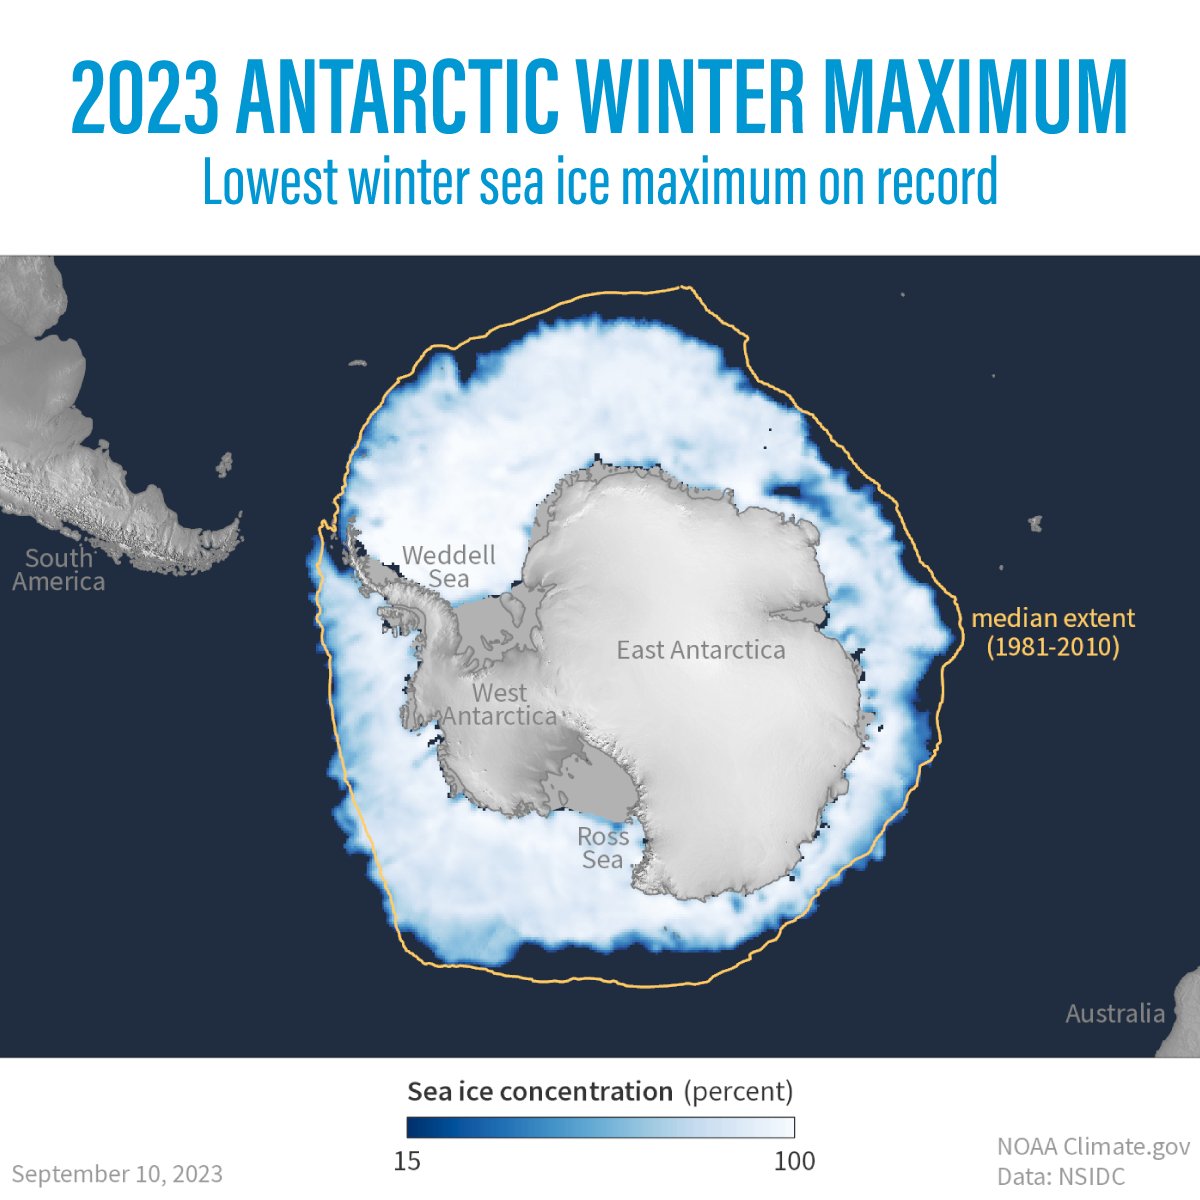
On September 10, 2023, sea ice in the Antarctic reached it's annual maximum extent, setting a record low maximum in the satellite record that began in 1979. Read more: climate.gov/news-features/…

On September 10, 2023, sea ice in the Antarctic reached it's annual maximum extent, setting a record low maximum in the satellite record that began in 1979. Read more: climate.gov/news-features/…
account_circle
NOAA Climate.gov(@NOAAClimate) 's Twitter Profile Photo

Read the highlights of the Bulletin of the American Meteorological Society (BAMS) State of the Climate Report in 2022. climate.gov/news-features/…

account_circle
NOAA Climate.gov(@NOAAClimate) 's Twitter Profile Photo

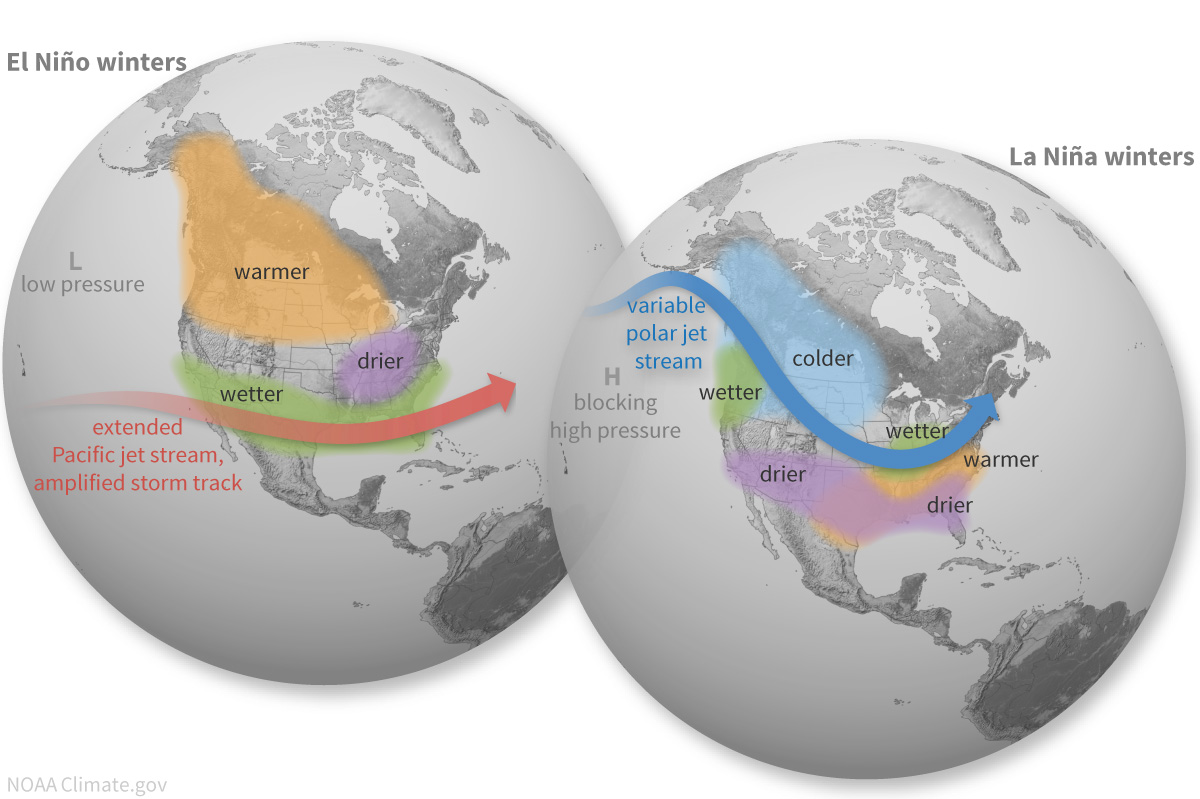
Our latest ENSO blog dives into how this year's robust El Niño could impact winter weather and climate across North America. climate.gov/news-features/…

#ICYMI Our latest ENSO blog dives into how this year's robust El Niño could impact winter weather and climate across North America. climate.gov/news-features/…
account_circle
ArcGIS Hub(@ArcGISHub) 's Twitter Profile Photo

The Climate Mapping for Resilience and Adaptation Portal provides access to climate data. View real-time statistics and maps documenting where people, property, and infrastructure may be exposed to hazards such as flooding. ow.ly/UesZ103ZMky NOAA Climate.gov

The Climate Mapping for Resilience and Adaptation Portal provides access to climate data. View real-time statistics and maps documenting where people, property, and infrastructure may be exposed to hazards such as flooding. ow.ly/UesZ103ZMky @NOAAClimate
account_circle
NOAA Climate.gov(@NOAAClimate) 's Twitter Profile Photo

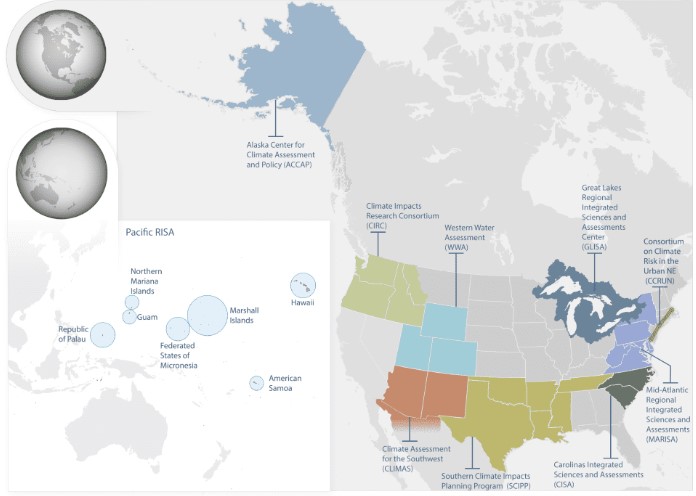
Extreme heat continues to increase due to climate change & so is the interest in addressing it across all levels of government. The CAP/RISA program is essential to ensuring that communities of all sizes across the US are better prepared for extreme heat. climate.gov/news-features/…

Extreme heat continues to increase due to climate change & so is the interest in addressing it across all levels of government. The CAP/RISA program is essential to ensuring that communities of all sizes across the US are better prepared for extreme heat. climate.gov/news-features/…
account_circle
NOAA Climate.gov(@NOAAClimate) 's Twitter Profile Photo

The October temperature and precipitation outlooks from NWS Climate Prediction Center are out. Oct looks to trend warm for much of the country. The Pacific Northwest & eastern U.S. could see below normal precipitation while portions of the western and central U.S. could see above normal precipitation.
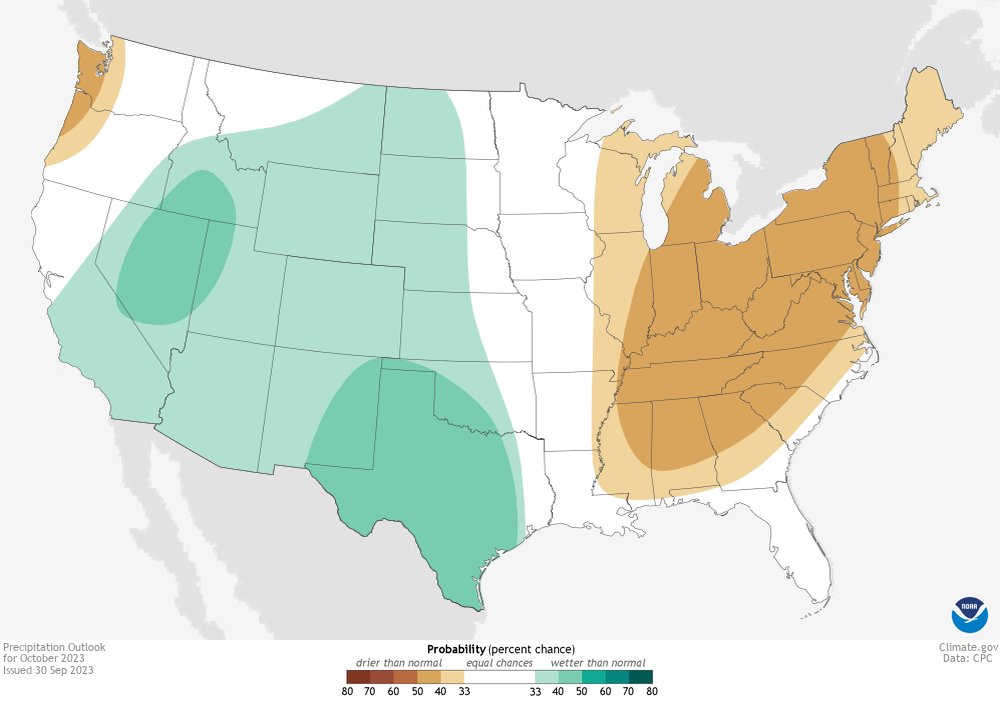
The October temperature and precipitation outlooks from @NWSCPC are out. Oct looks to trend warm for much of the country. The Pacific Northwest & eastern U.S. could see below normal precipitation while portions of the western and central U.S. could see above normal precipitation.
account_circle
NOAA Climate.gov(@NOAAClimate) 's Twitter Profile Photo

Extreme heat has implications for power grid infrastructure, food production and nutrition, childhood education, worker health and safety, and crime. climate.gov/news-features/…

Extreme heat has implications for power grid infrastructure, food production and nutrition, childhood education, worker health and safety, and crime. climate.gov/news-features/…
account_circle